Engagement, Not Creation, Is the Top Content Goal
“Somewhere in all of that underutilized content is information that will move the needle for HCPs
and patients.”
— John Postley, Senior Associate Director of Content Strategy and Impact, Boehringer Ingelheim
Advancements in AI are generating excitement about creating more personalized content at a faster rate. The industry’s
output rises yearly, a trajectory expected to intensify with the emerging technology.
However, there’s a disparity between the investment and enthusiasm in creating more content and the efforts to
measure and use what moves the needle the most. Veeva Pulse Field Trends data demonstrates that effective content
usage drastically improves treatment adoption and boosts access. Yet, few biopharmas have successfully ramped up
usage to a consistently higher rate. Field teams still share material in fewer than half of customer interactions.
“We want to better understand what the field is using, how they use it, and how we can get closer to a 90 or 100%
usage,” says John Postley, senior associate director of content strategy and impact at Boehringer Ingelheim.
Applying AI with engagement as the goal, not just content creation, can help create the right material more efficiently
and surface deeply contextual content with opportunities for the field to use it. Ultimately, the approach will activate
information with the greatest impact in the moment of need.

Dan Rizzo
VP, Global Head of Business Consulting

Despite doubling patient starts and improving access,
content usage remains below 50%
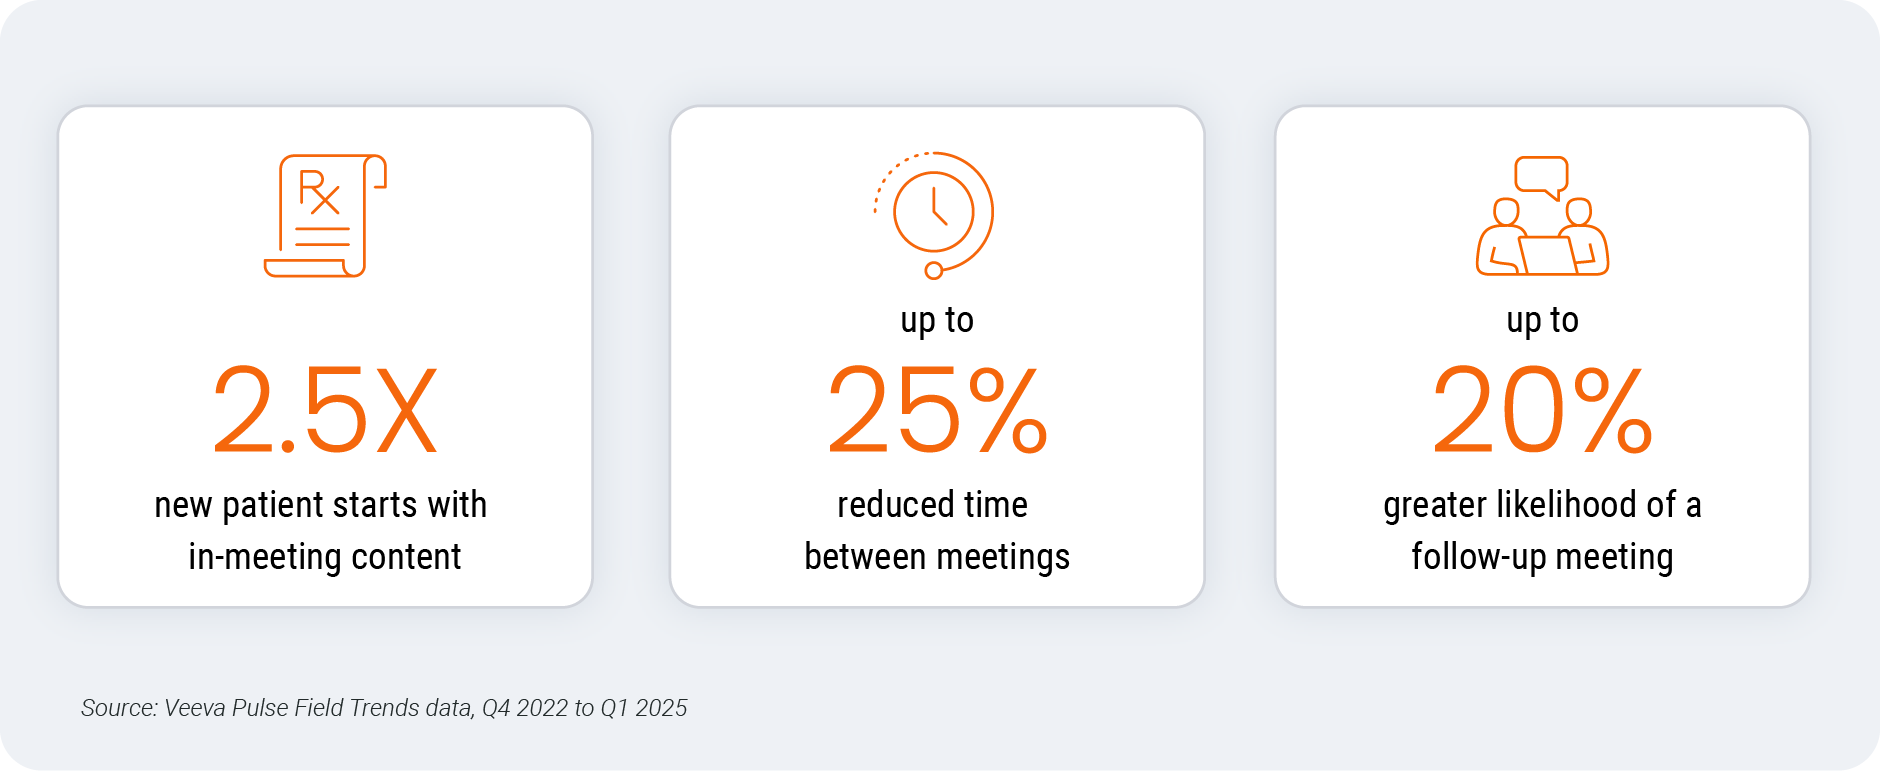
Veeva Pulse Field Trends data since 2022 demonstrates that HCP engagements with shared content
result in more than double the new patient treatment starts. Using the right content also extends
conversations, moves customers along their journey, shortens the time between meetings by up to 25%,
and increases the likelihood of a follow-up by up to 20% (Figure 1).
Figure 1: Benefits of relevant and timely content-sharing
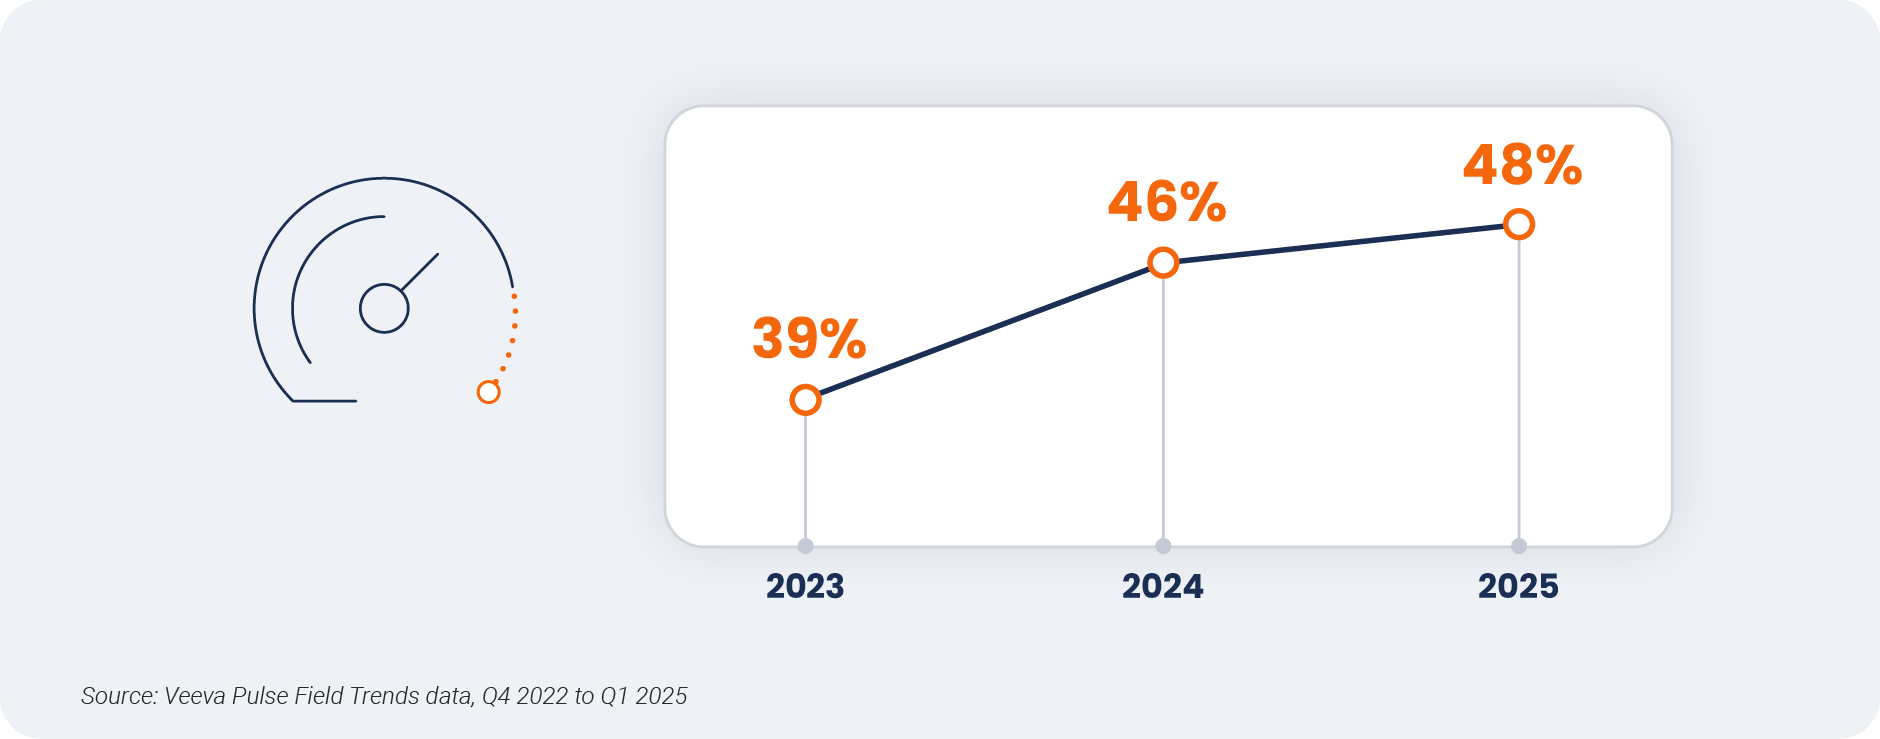
Despite the proven effectiveness, there is a clear disconnect between content creation strategies and
field execution. Field teams continue to struggle to leverage content, using it in less than 50% of meetings.
And nearly 80% of approved content is rarely or never shared with customers.1
Figure 2: Percentage of engagements using content
Engagement is the right metric, not content creation
“Just because you can create more content doesn’t always mean you should. Your content
strategy should be in service of your business goals. While personalized content can help achieve
those goals, greater content volume is a side effect, not the goal.”
— Kara Hansen, Director of Product Management, Content, and Digital Asset Management, Genentech
New technology, such as GenAI and review automation, has created buzz for its ability to create more
content faster. Studies show AI could reduce content creation costs by 30-50% and accelerate
production speed by more than 20%.2 While this potential is impressive and will be helpful, biopharmas
must focus their efforts on effective and practical content to avoid creating more noise for HCPs already
contending with a great deal of information.
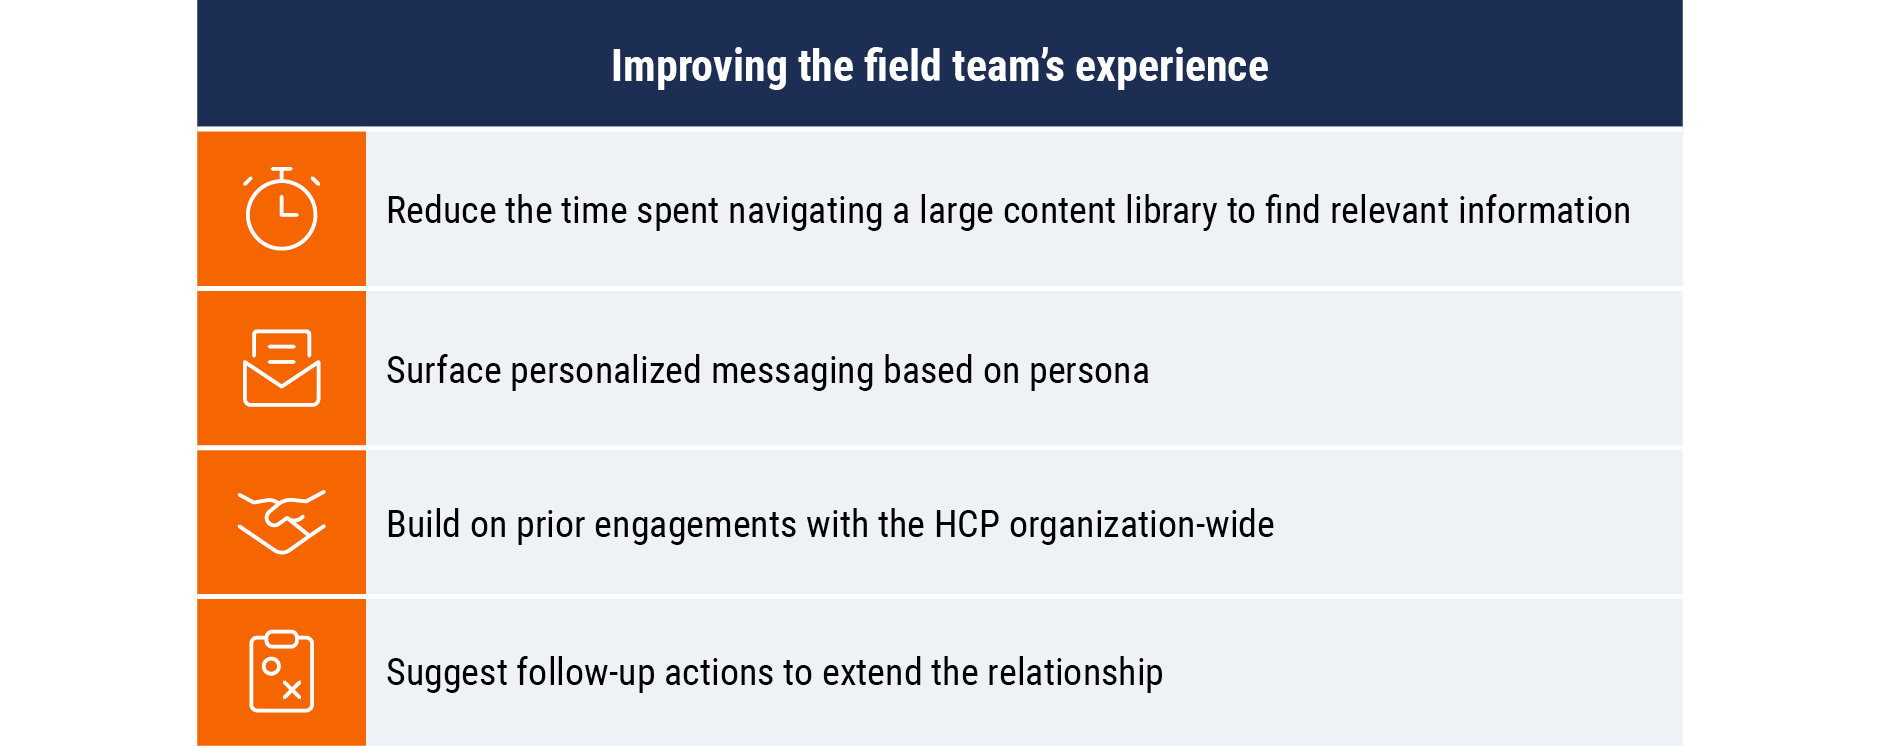
With prioritization on engagement use cases, AI can surface the most relevant assets in the moment of
need to build on prior interactions with an HCP. AI can connect the dots across previous engagements
and treatment inflection points to provide the context required to understand and deliver the most
helpful information. Simply providing more content exacerbates the problem, as the typical engagement
uses fewer than four slides.
Achieving these goals requires aligning the content strategy with field execution tactics. Feeding data
and insights from the field to marketing can help refine the approach and inform the next creation round.
Steps to stay focused on engagement
Organizations can take practical next steps to increase engagement with content. While AI has shown
potential for creating content and orchestrating engagement, it requires alignment of people, processes,
data, and capabilities to deliver personalization when it matters.
Key areas of continuous focus include:
- Establishing clear and measurable goals within AI investments that align to advancing HCPs along the customer journey
- Incentivizing behaviors that support connected engagement across sales, marketing, and medical
- Training the field with a focus on AI adoption that supports content engagement
- Using engagement and impact data to iterate content strategy and inform future creation
Connect with Veeva Business Consulting to learn how Veeva Pulse data can improve HCP
engagement for your field team.
1Veeva Pulse Field Trends Report, Q4 2023
2 Generative AI in the pharmaceutical industry: Moving from hype to reality, McKinsey & Company, Jan. 2024
Global and Regional Trends
This report highlights global and regional field engagement trends from Veeva Pulse data gathered between January
2024 and March 2025. Veeva Pulse data is sourced from Veeva’s aggregated CRM activity, including field engagement
stats from all instances of Veeva CRM globally. In this report, comparisons in trending charts are year over year, Q1
2024 to Q1 2025, while non-trending charts contain quarter-over-quarter comparisons, Q4 2024 to Q1 2025.
Global trends*
Figure 1: Channel mix evolution, global
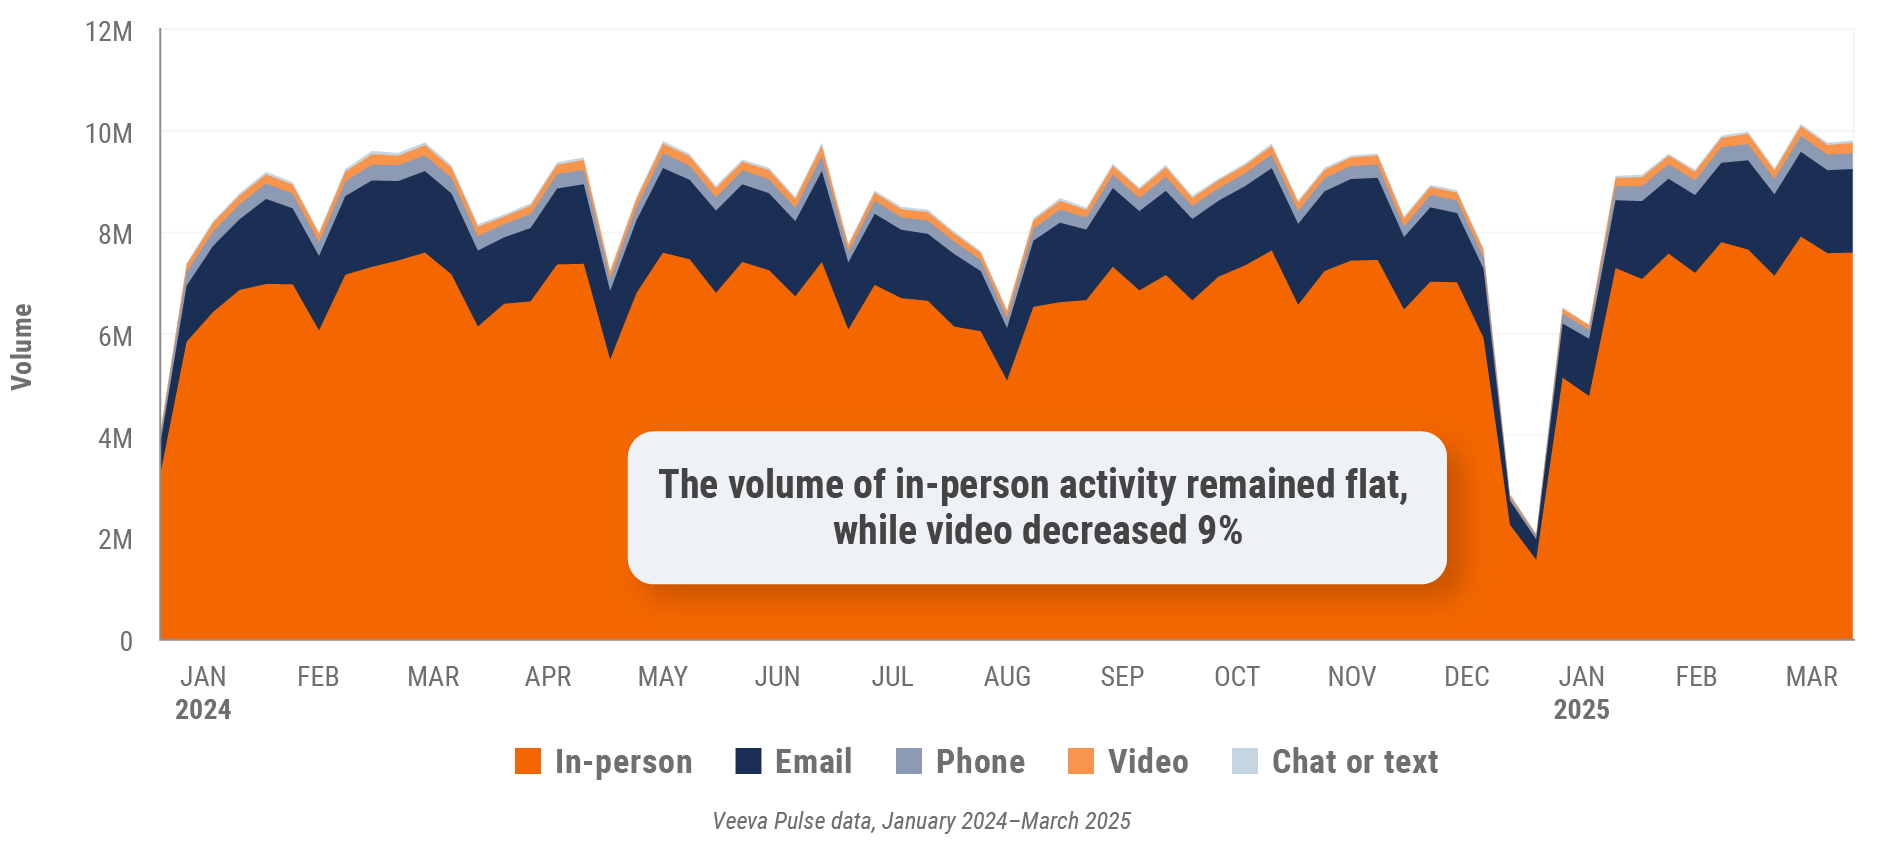
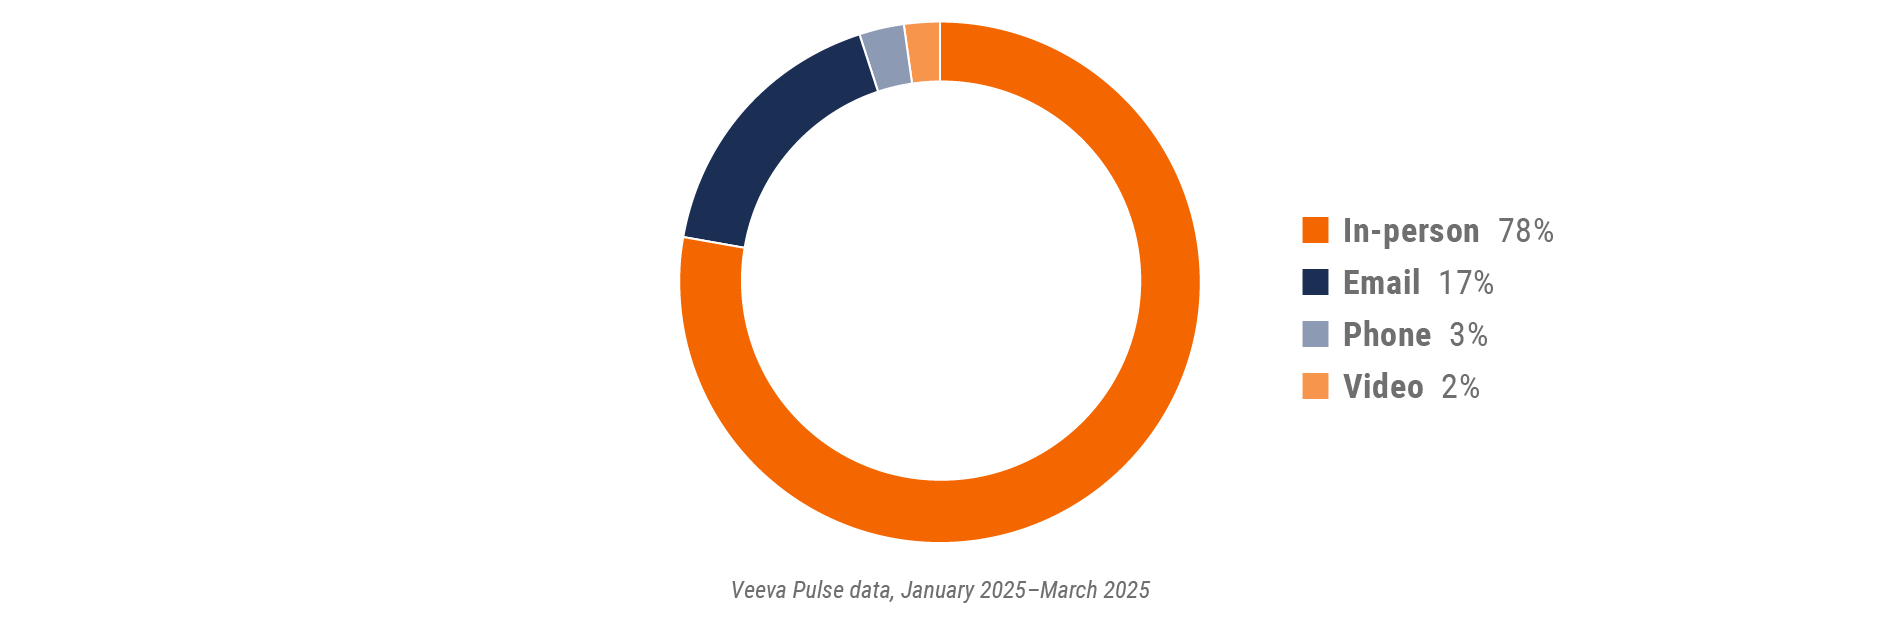
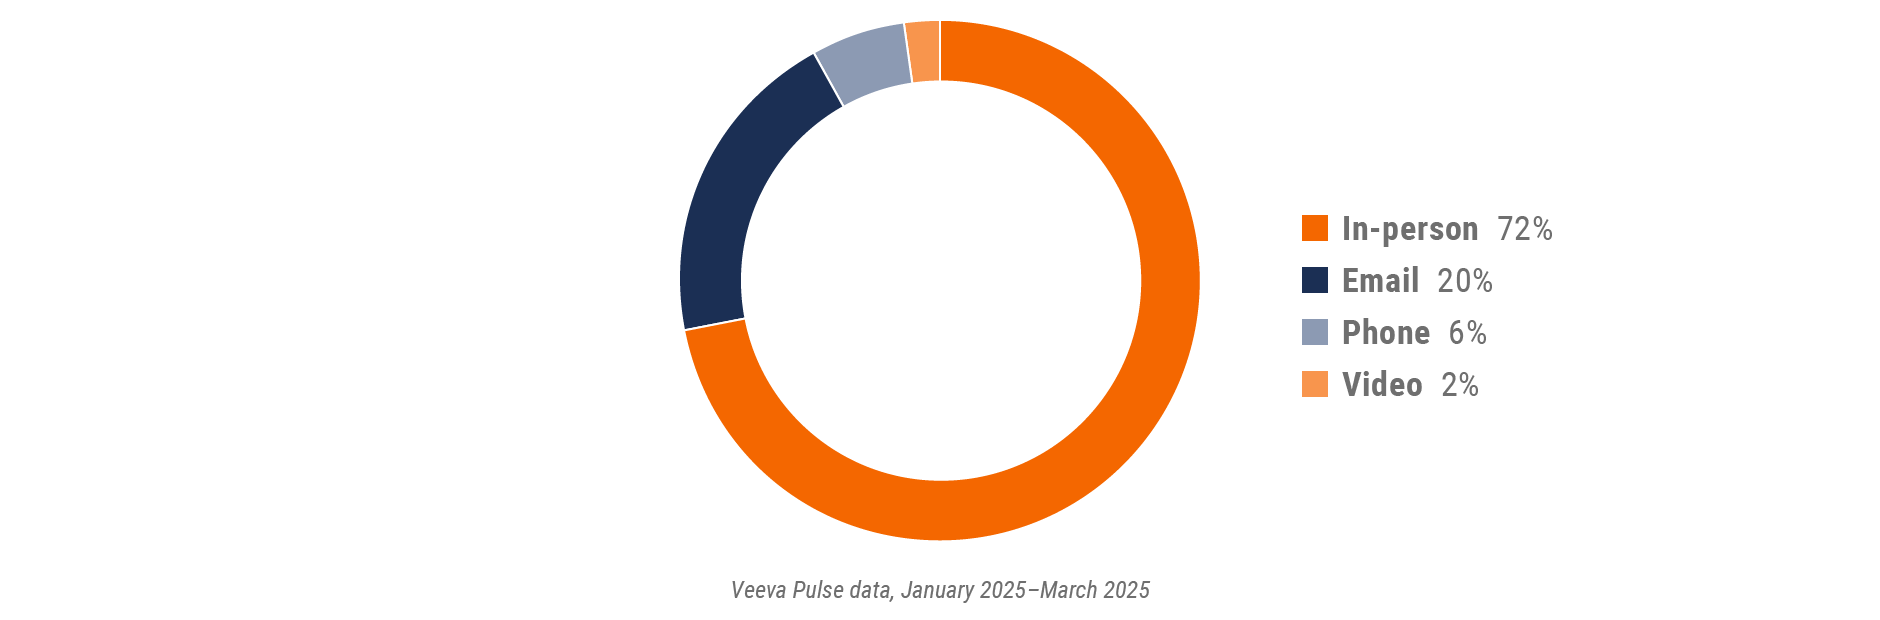
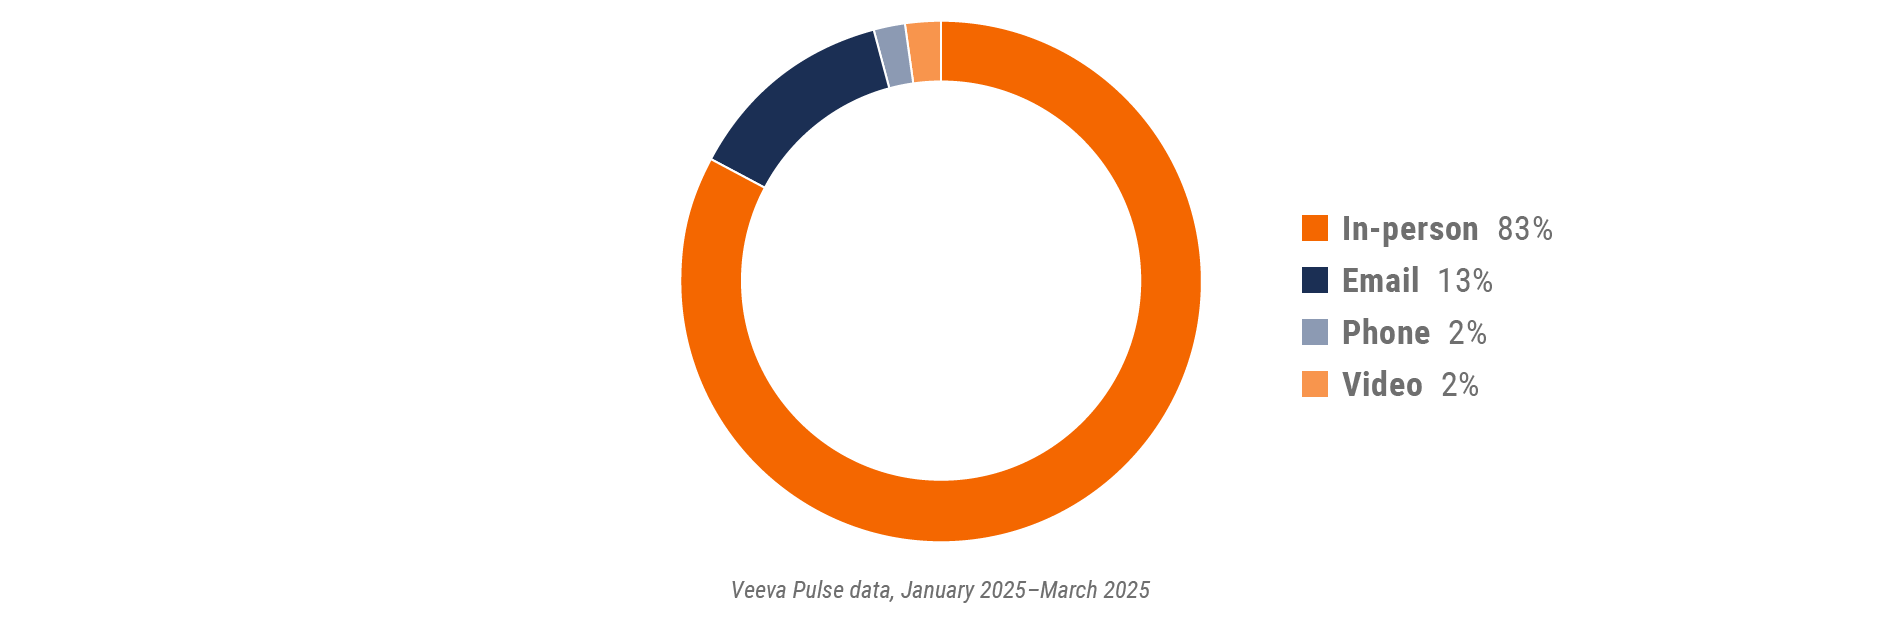
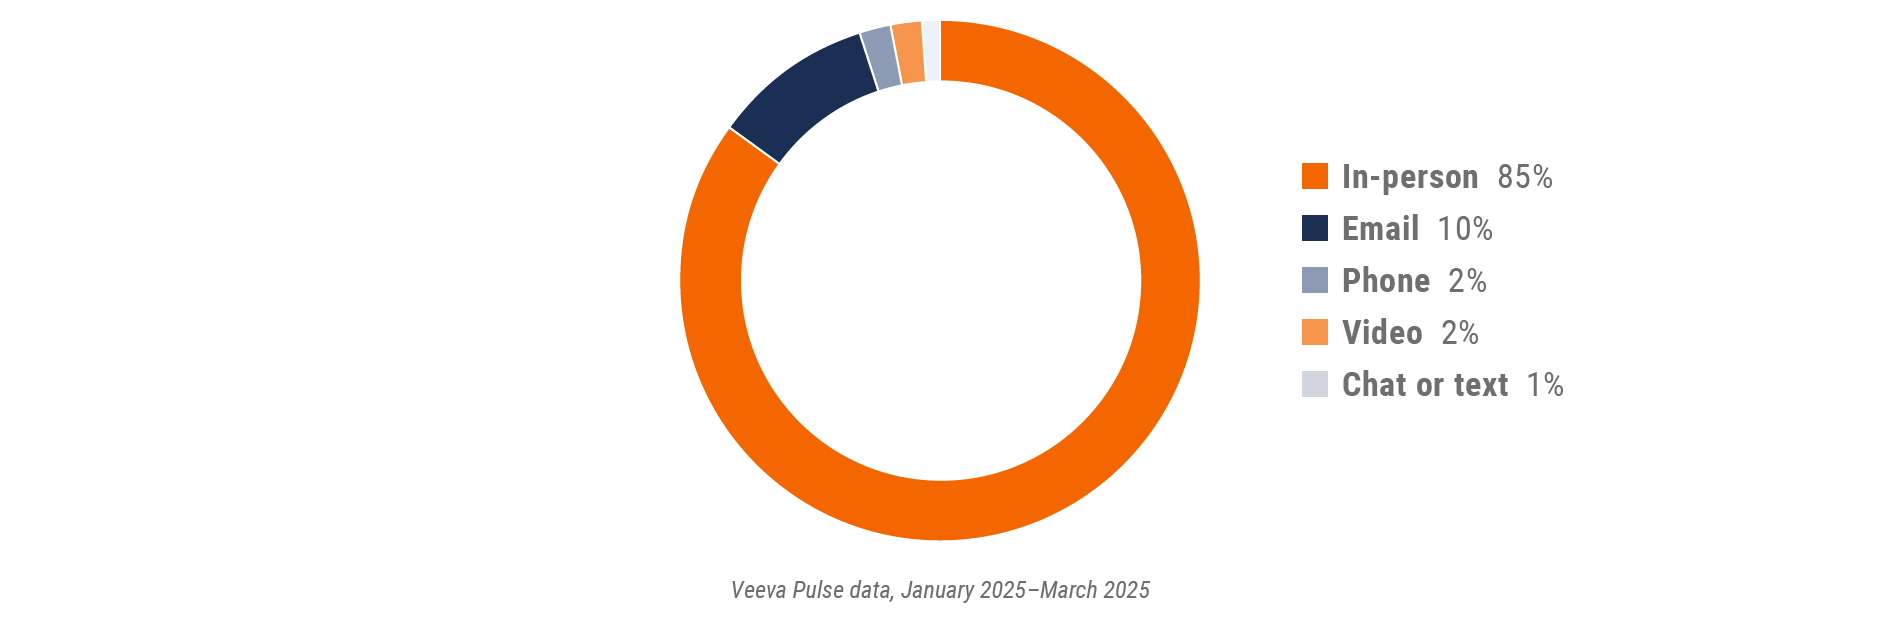
Figure 2: Channel mix, global
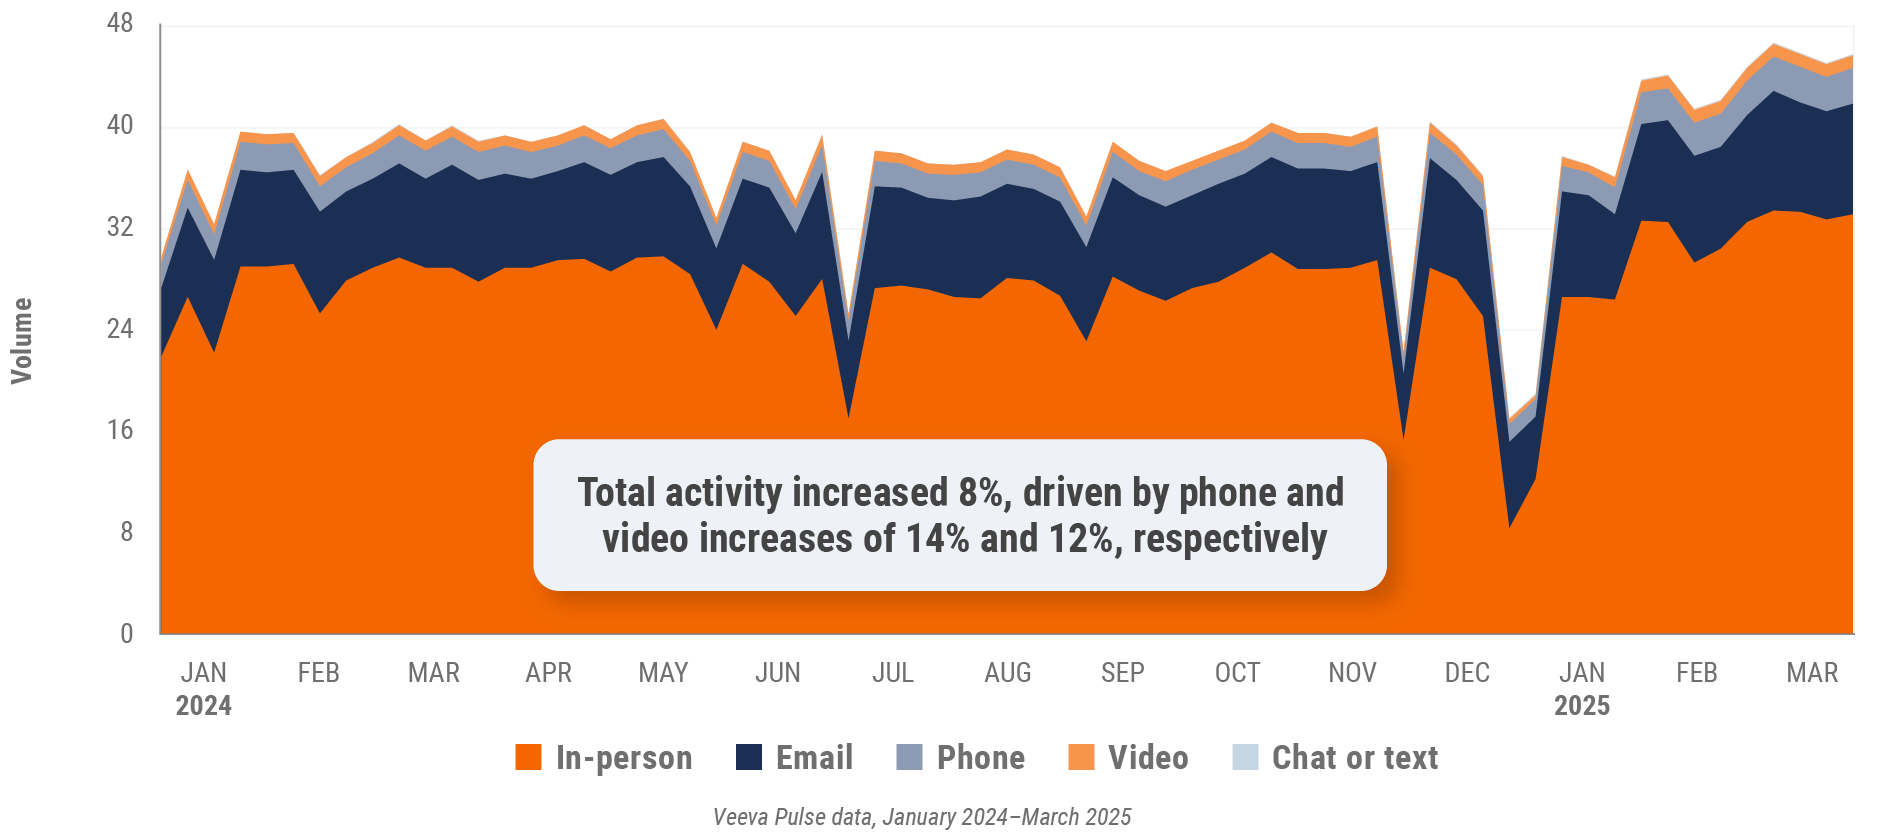
Global field team activity
Weekly activity per user by engagement channel
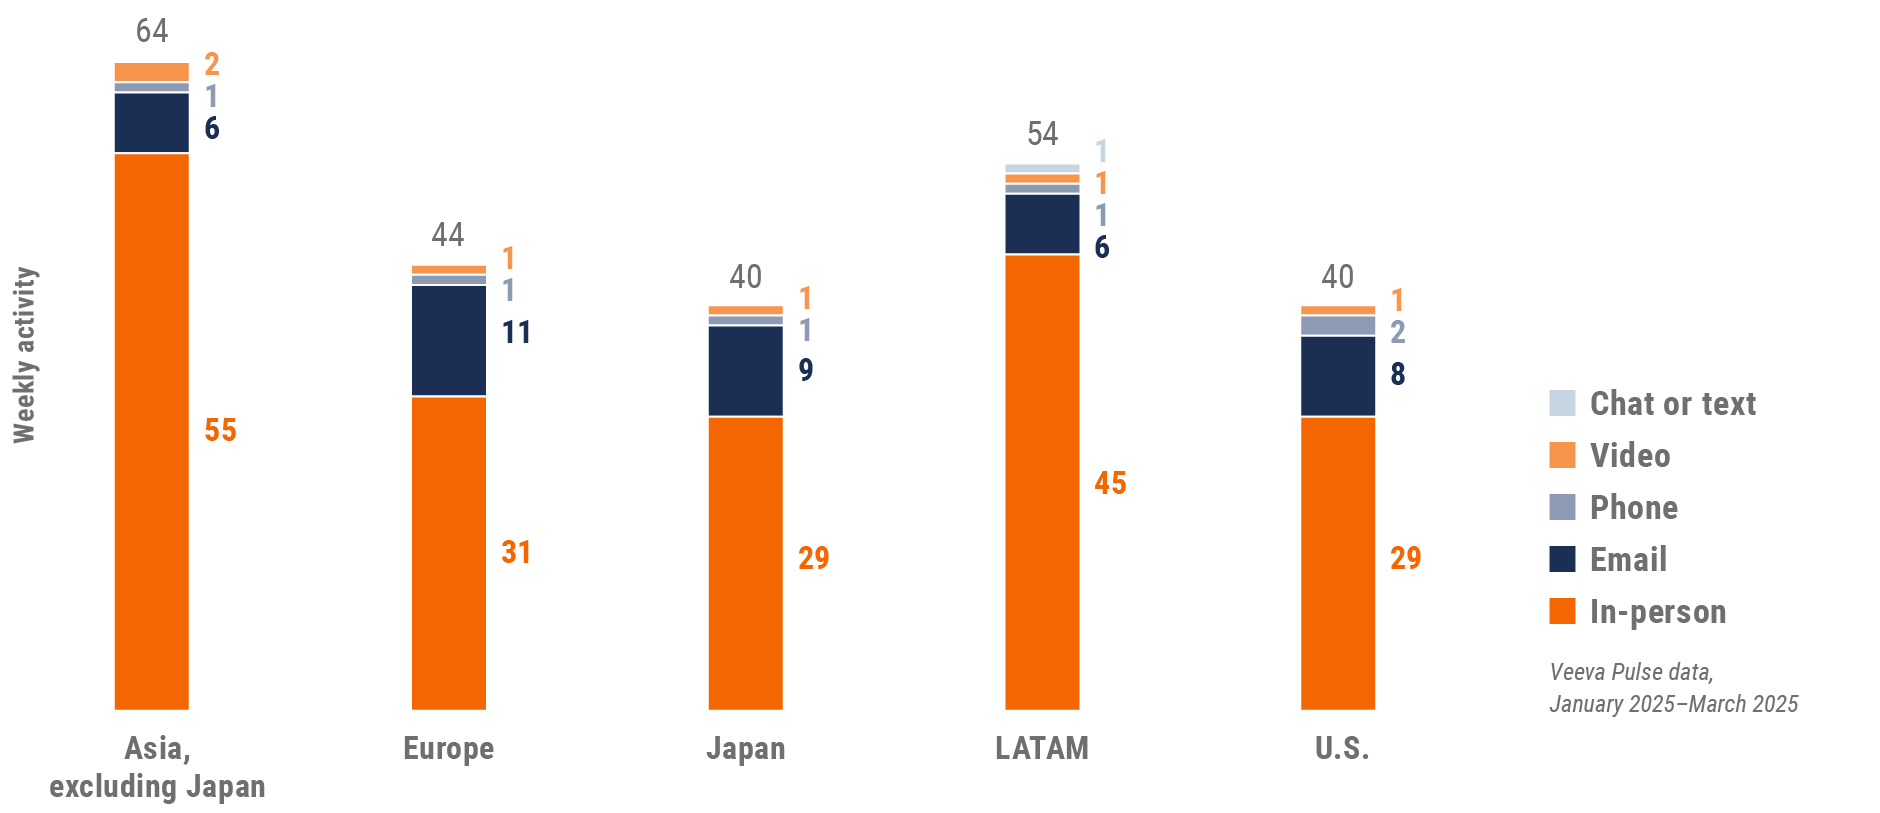
Figure 3: Activity by region, global
Global engagement quality
Consolidation of key quality metrics
Figure 4: Approved email volume, global
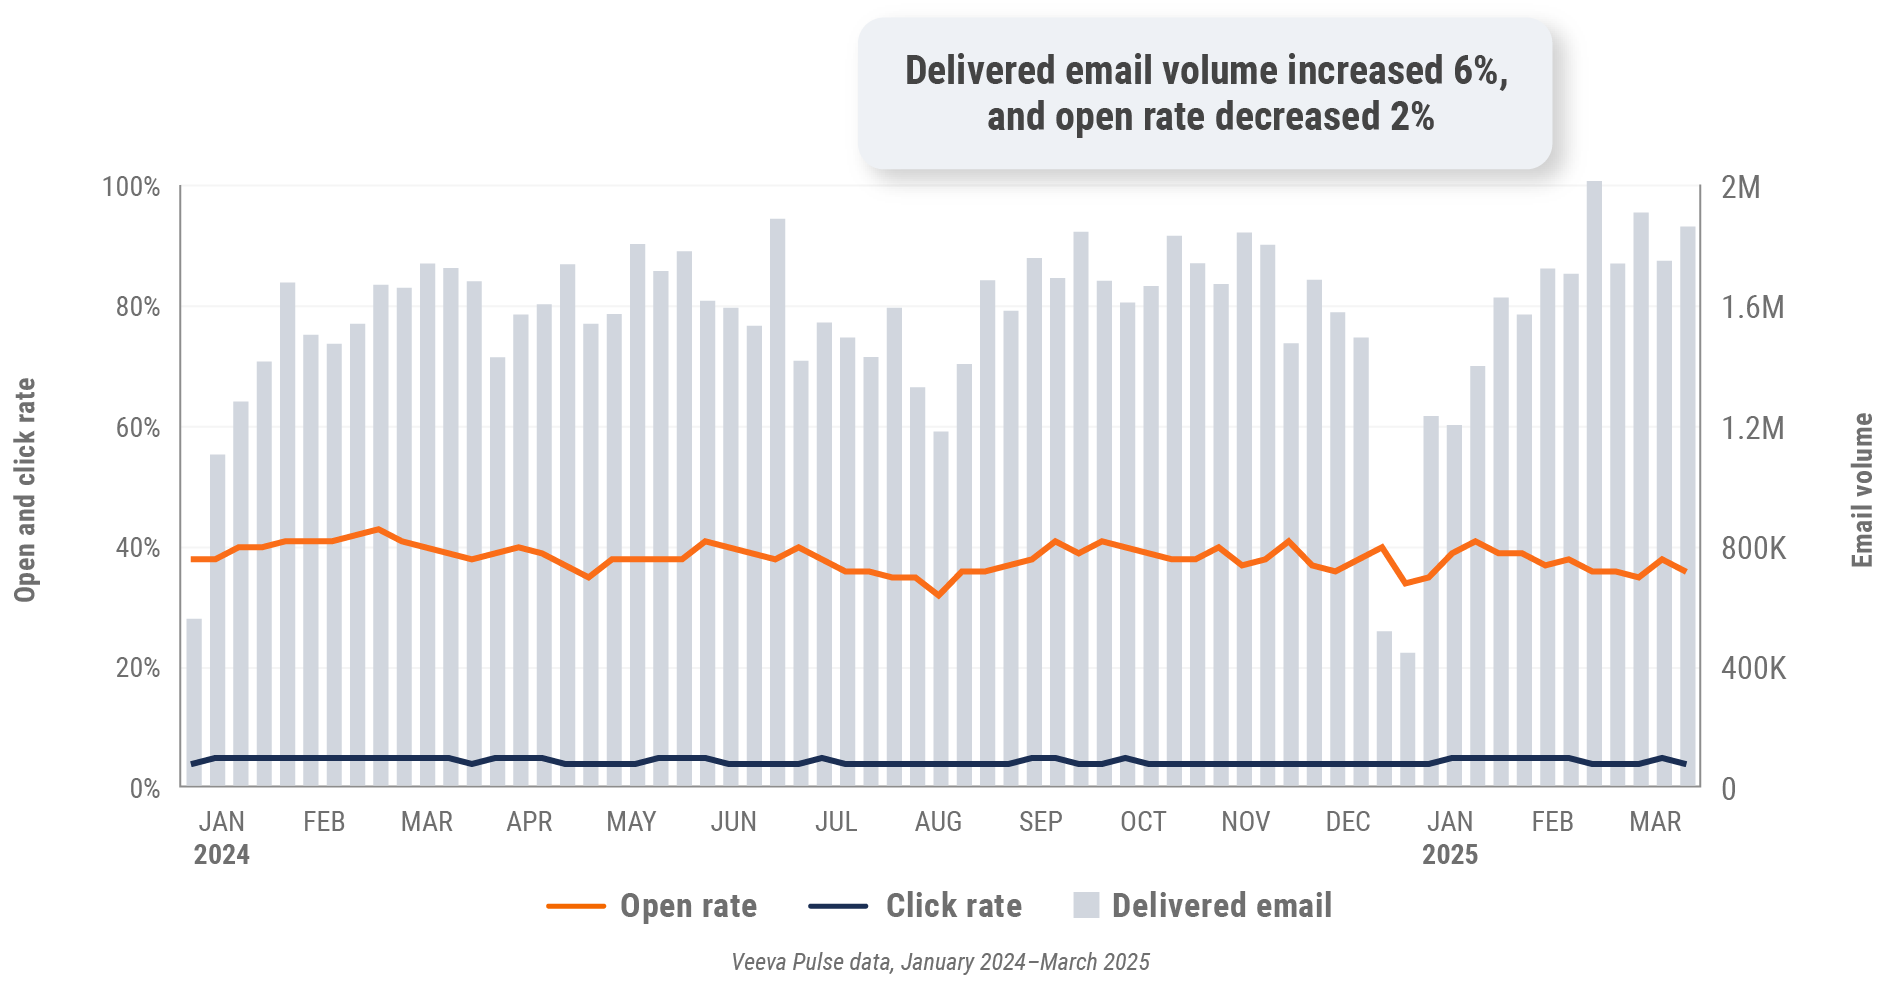
Figure 5: Content usage by channel, global
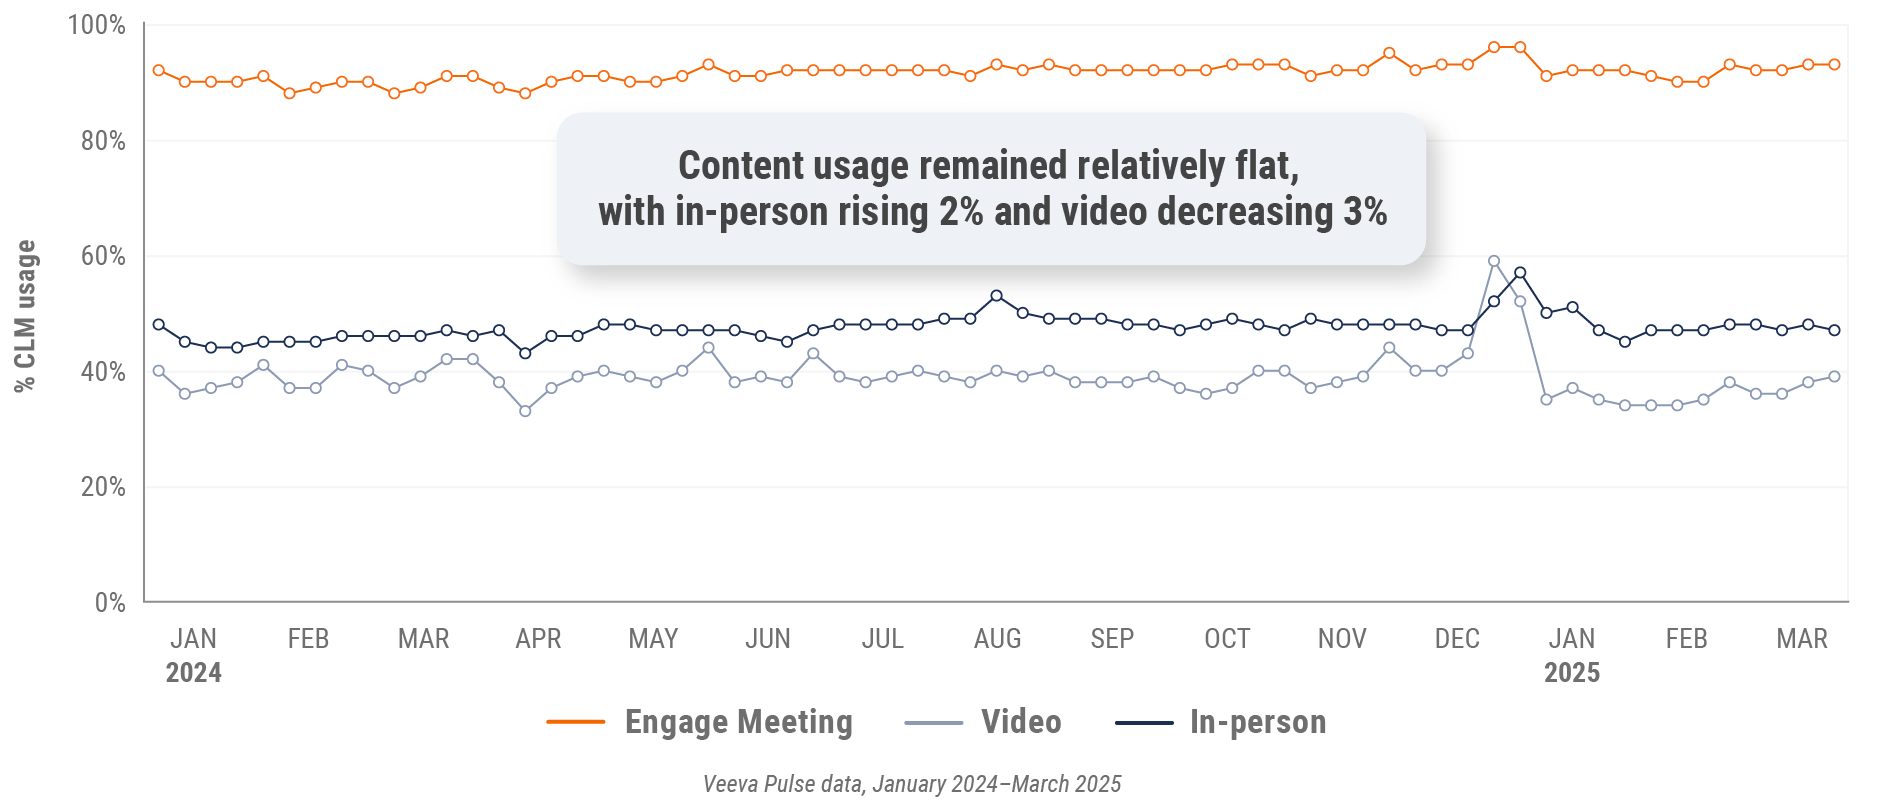
Figure 6: Veeva CRM Engage meeting duration, global

*This quarter’s global trends report omits data from China.
U.S. market trends
Figure 7: Channel mix evolution, U.S.
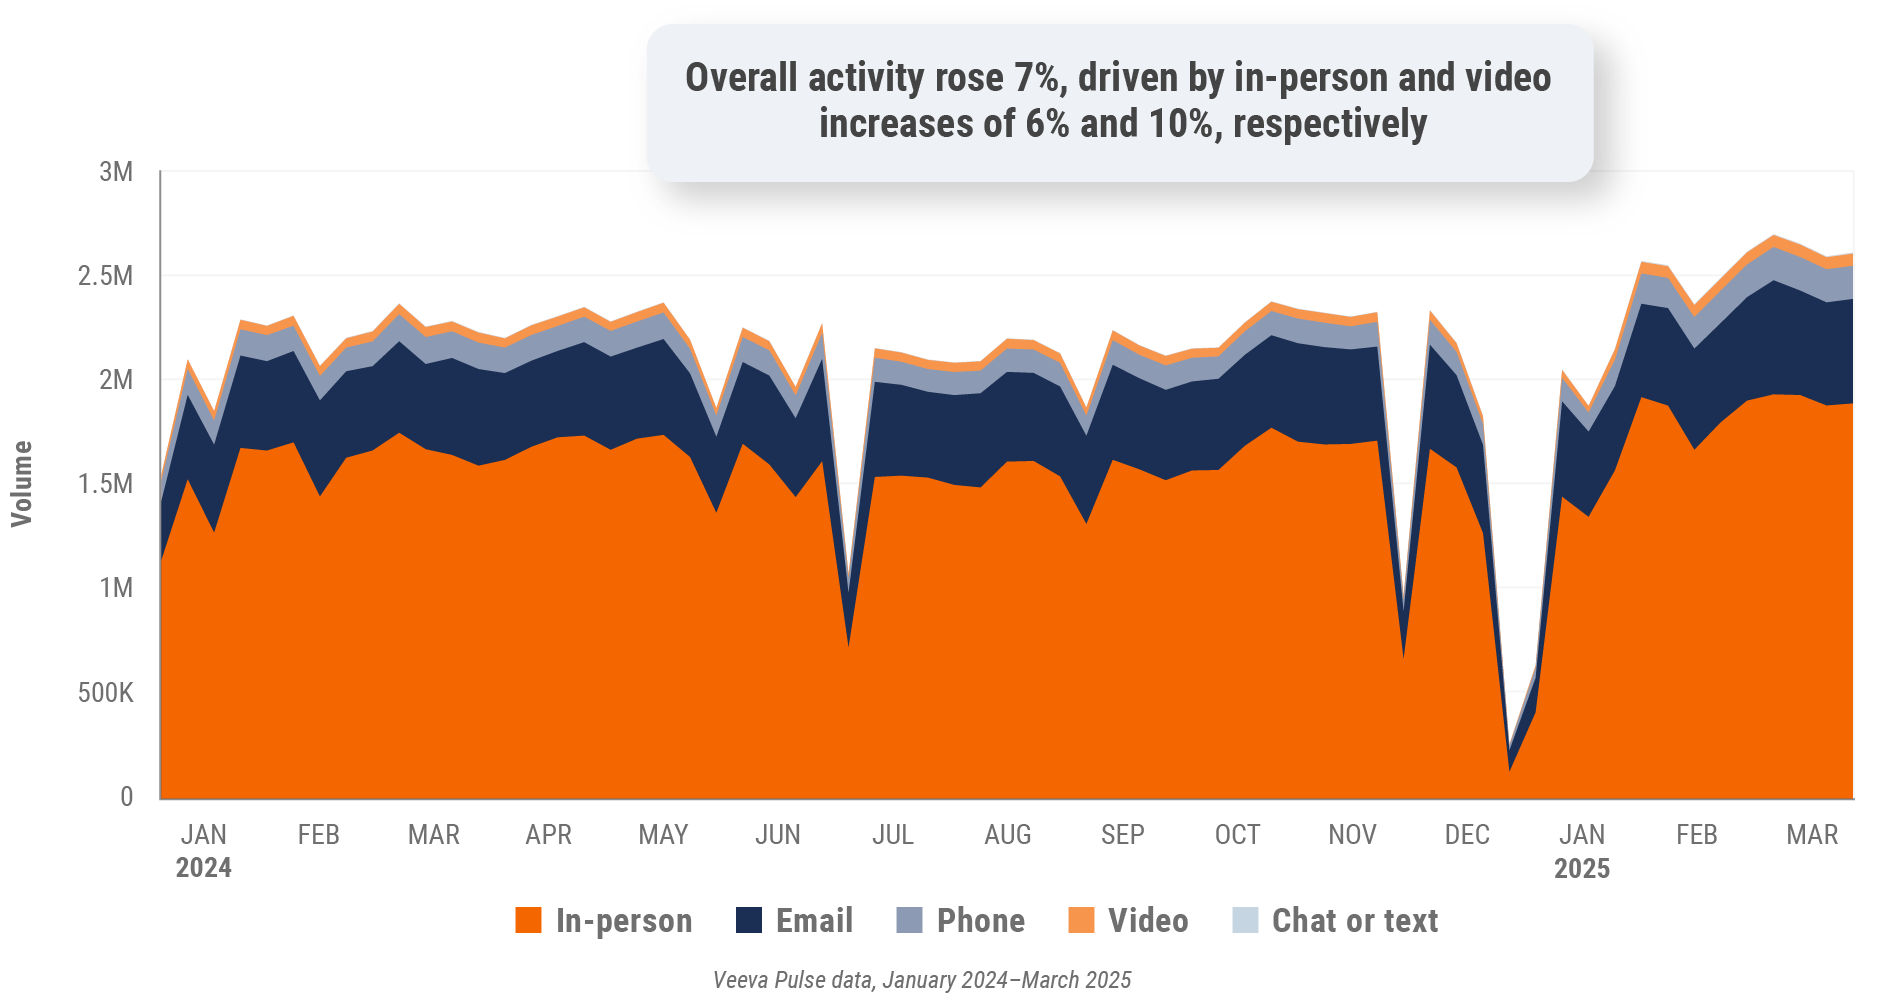
Figure 8: Channel mix, U.S.
U.S. field team activity
Weekly activity per user by engagement channel
Figure 9: Activity, U.S.
U.S. engagement quality
Consolidation of key quality metrics
Figure 10: Approved email volume, U.S.
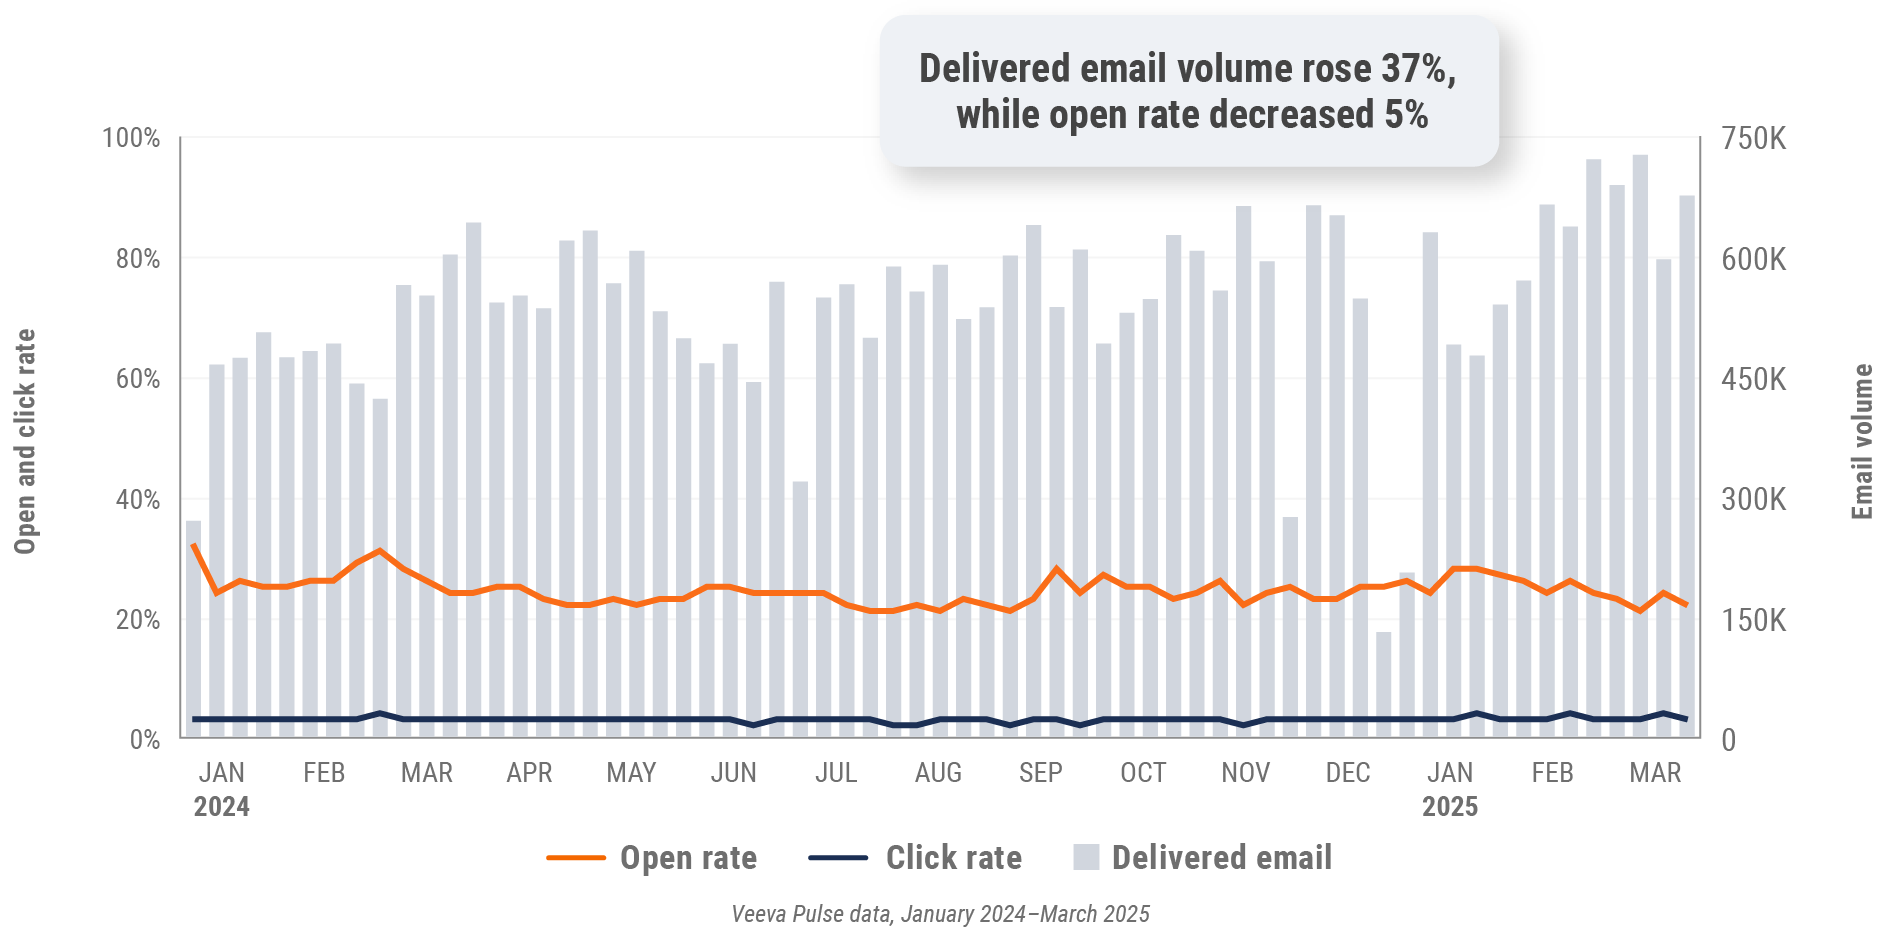
Figure 11: Content usage by channel, U.S.
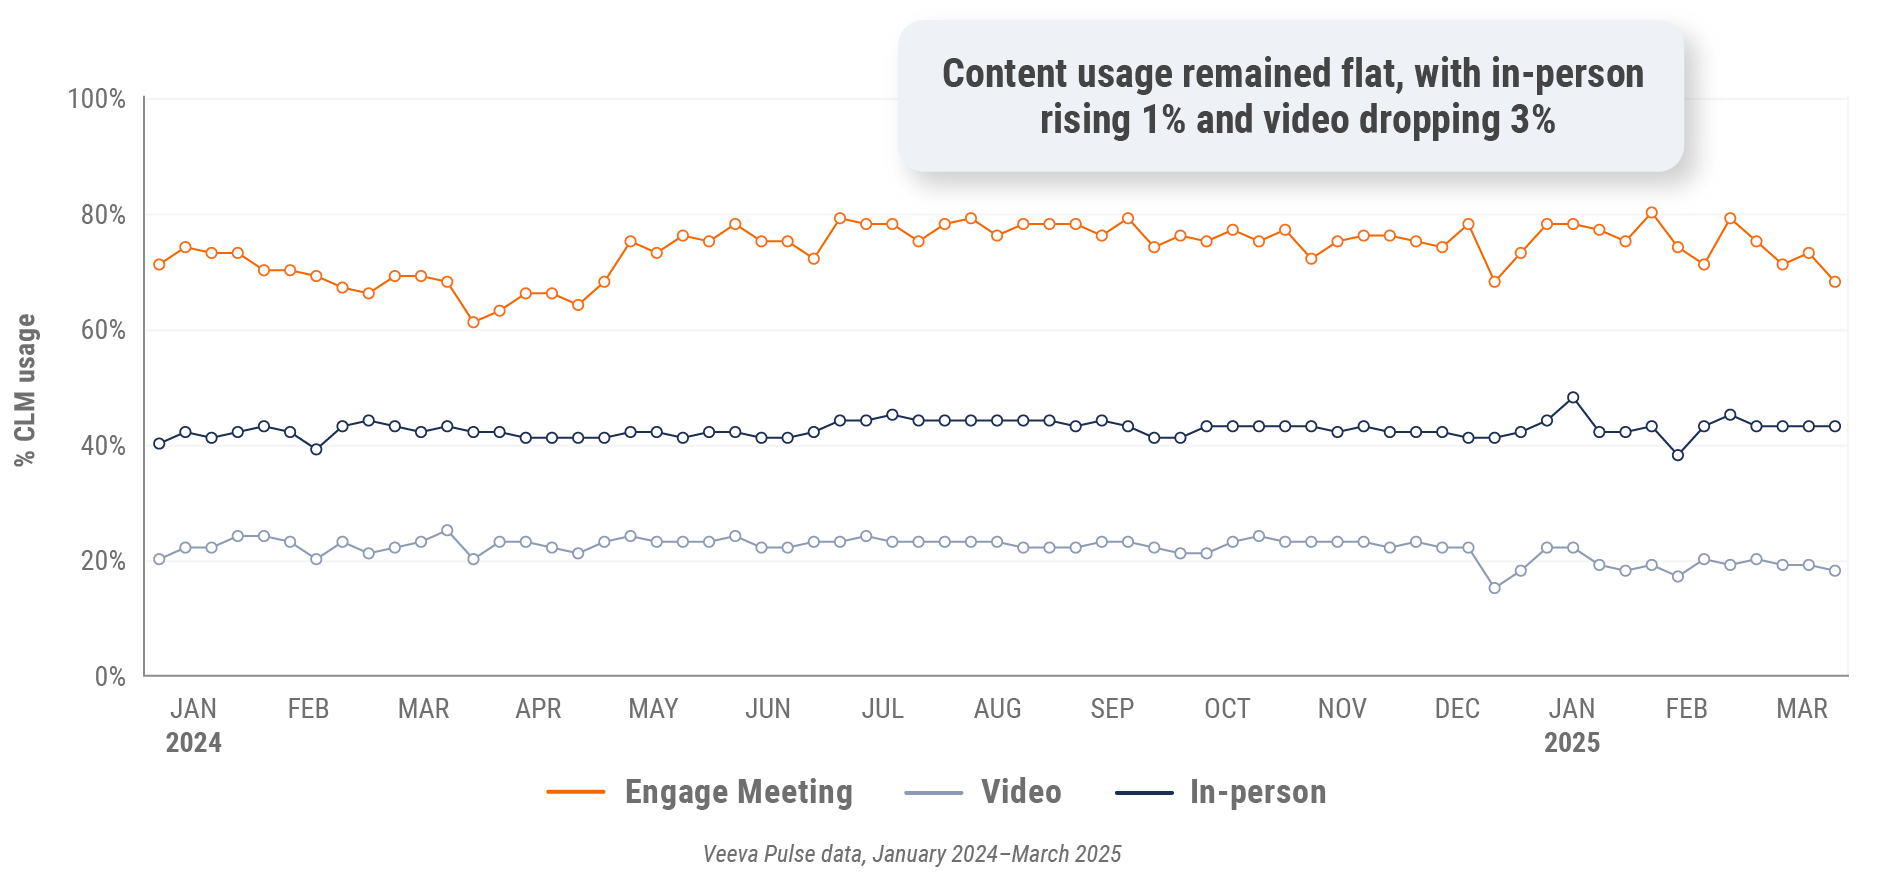
Figure 12: Veeva CRM Engage meeting duration, U.S.

Europe market trends
Figure 13: Channel mix evolution, Europe
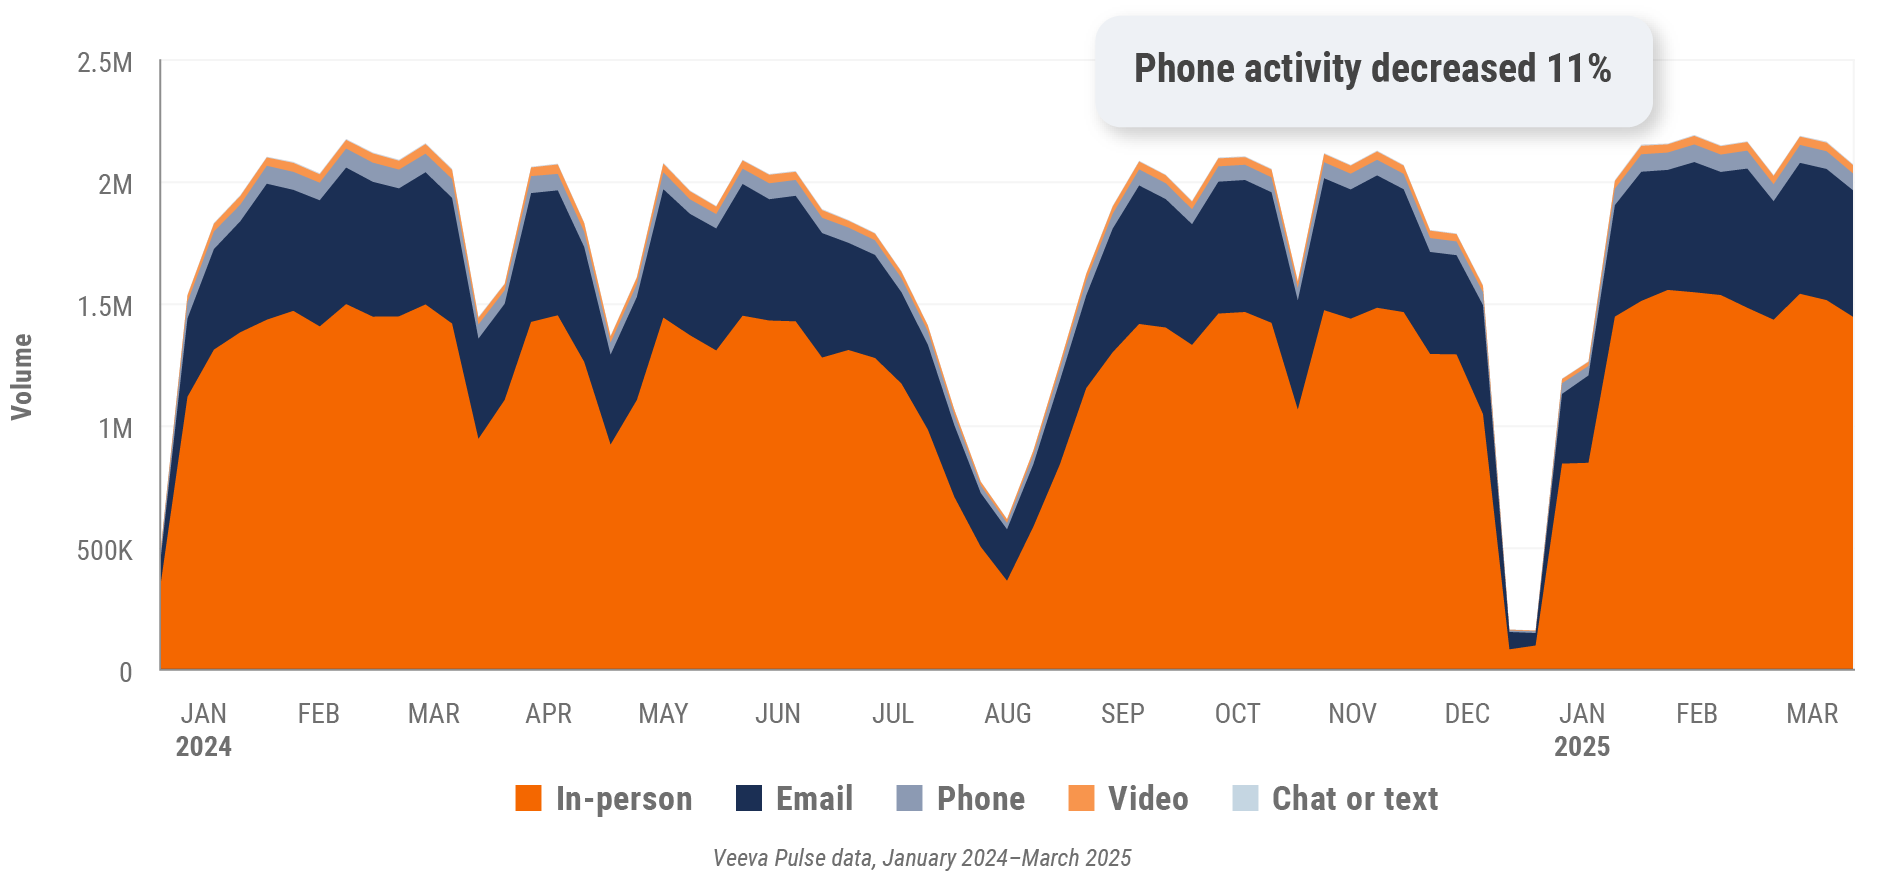
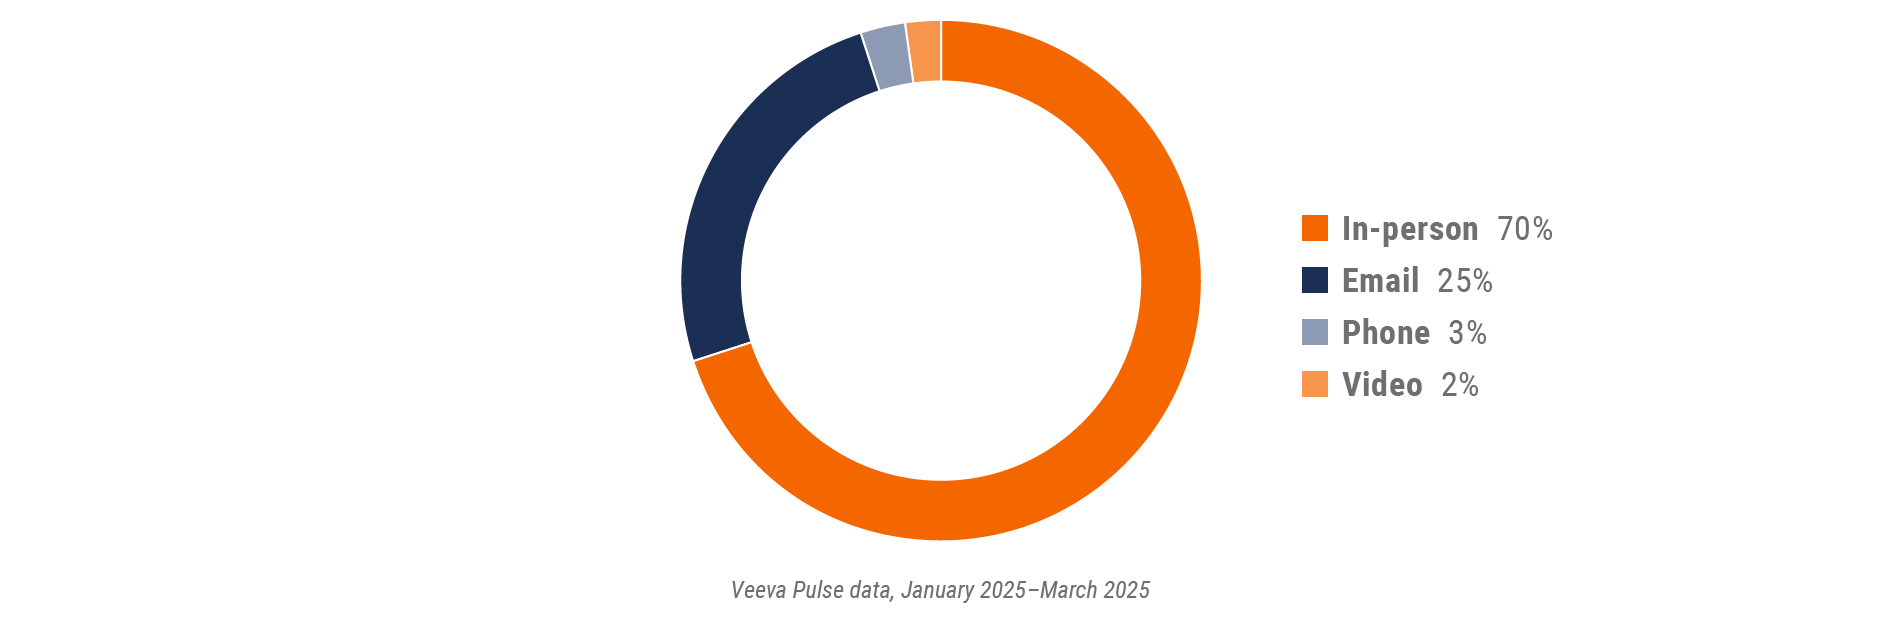
Figure 14: Channel mix, Europe
Europe field team activity
Weekly activity per user by engagement channel
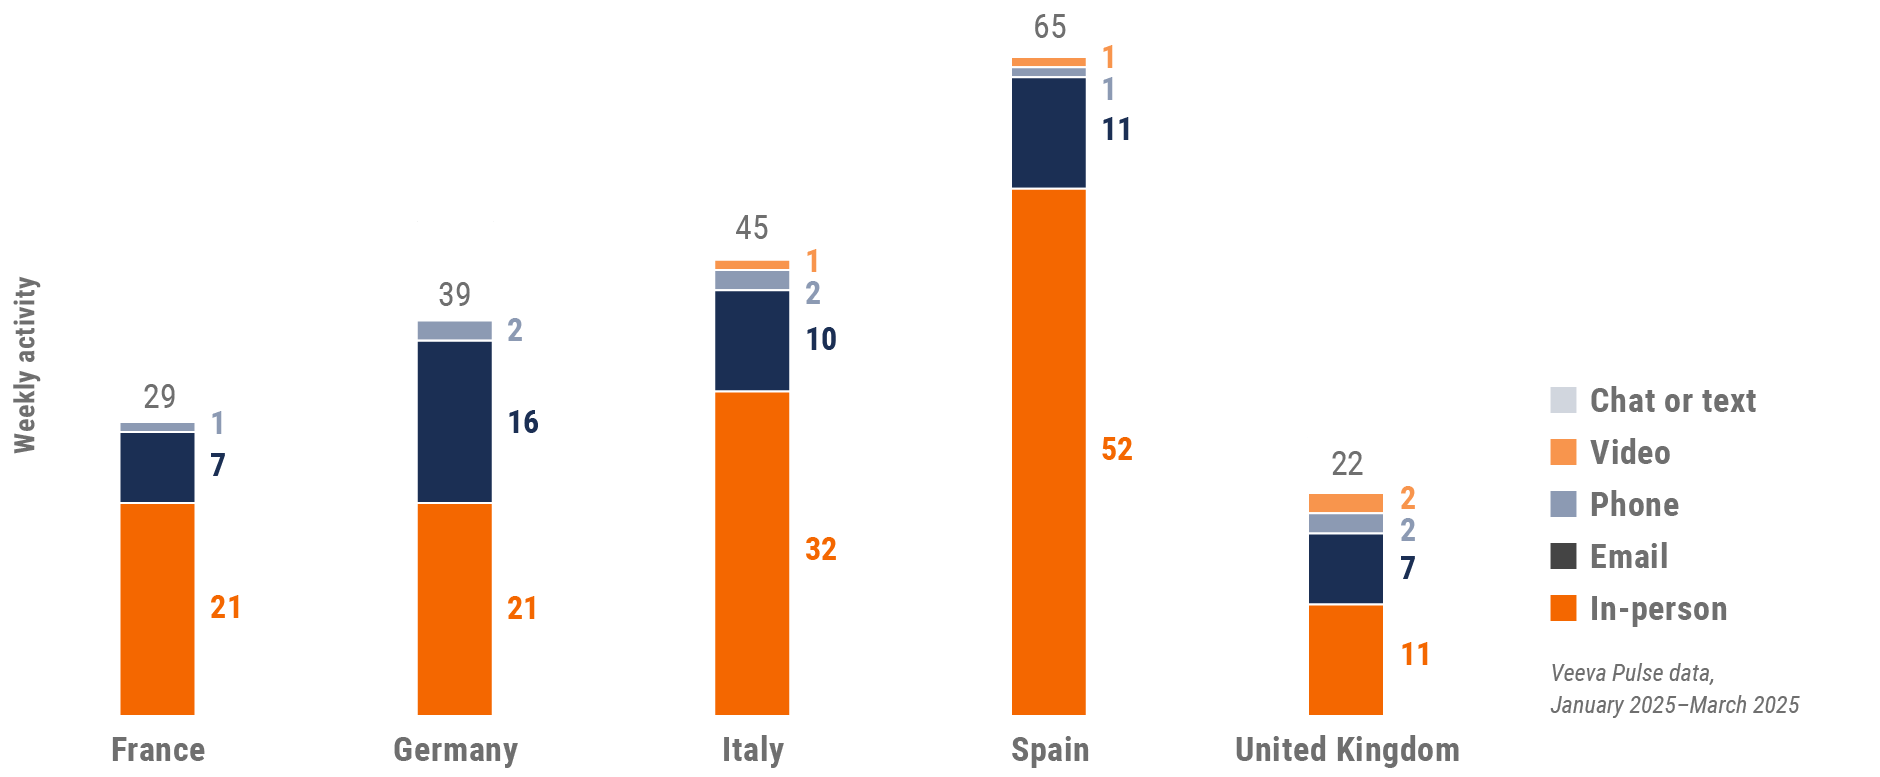
Figure 15: Activity by country, EU5
Europe engagement quality
Consolidation of key quality metrics
Figure 16: Approved email volume, Europe
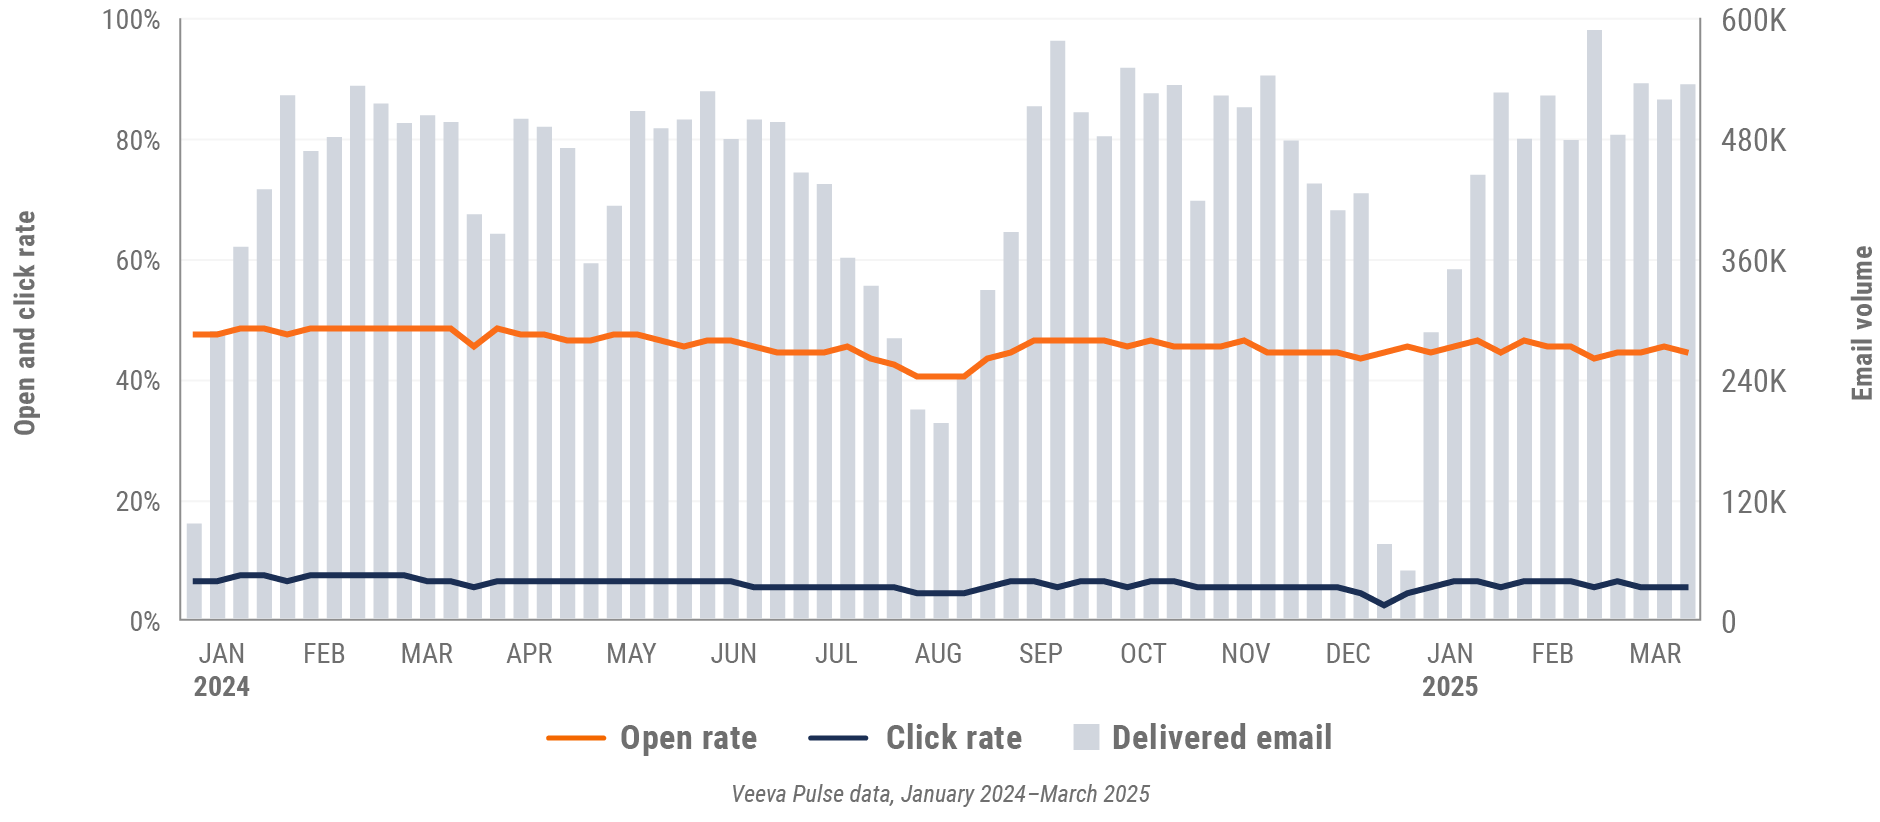
Figure 17: Content usage by channel, Europe
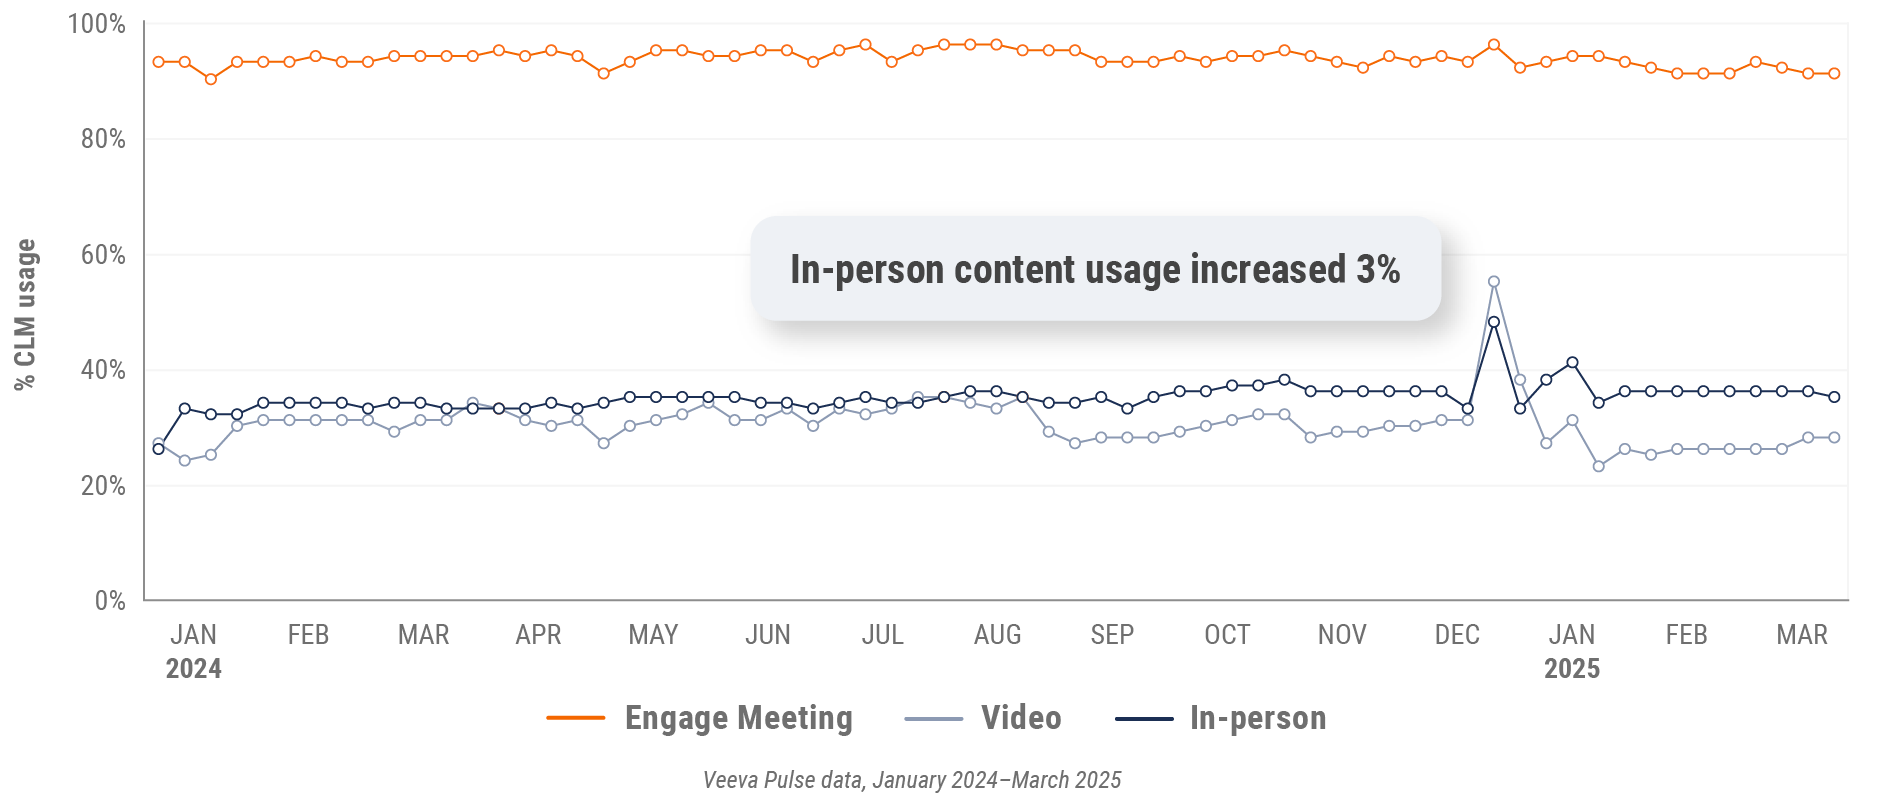
Figure 18: Veeva CRM Engage meeting duration, Europe

Asia market trends
Figure 19: Channel mix evolution, Asia
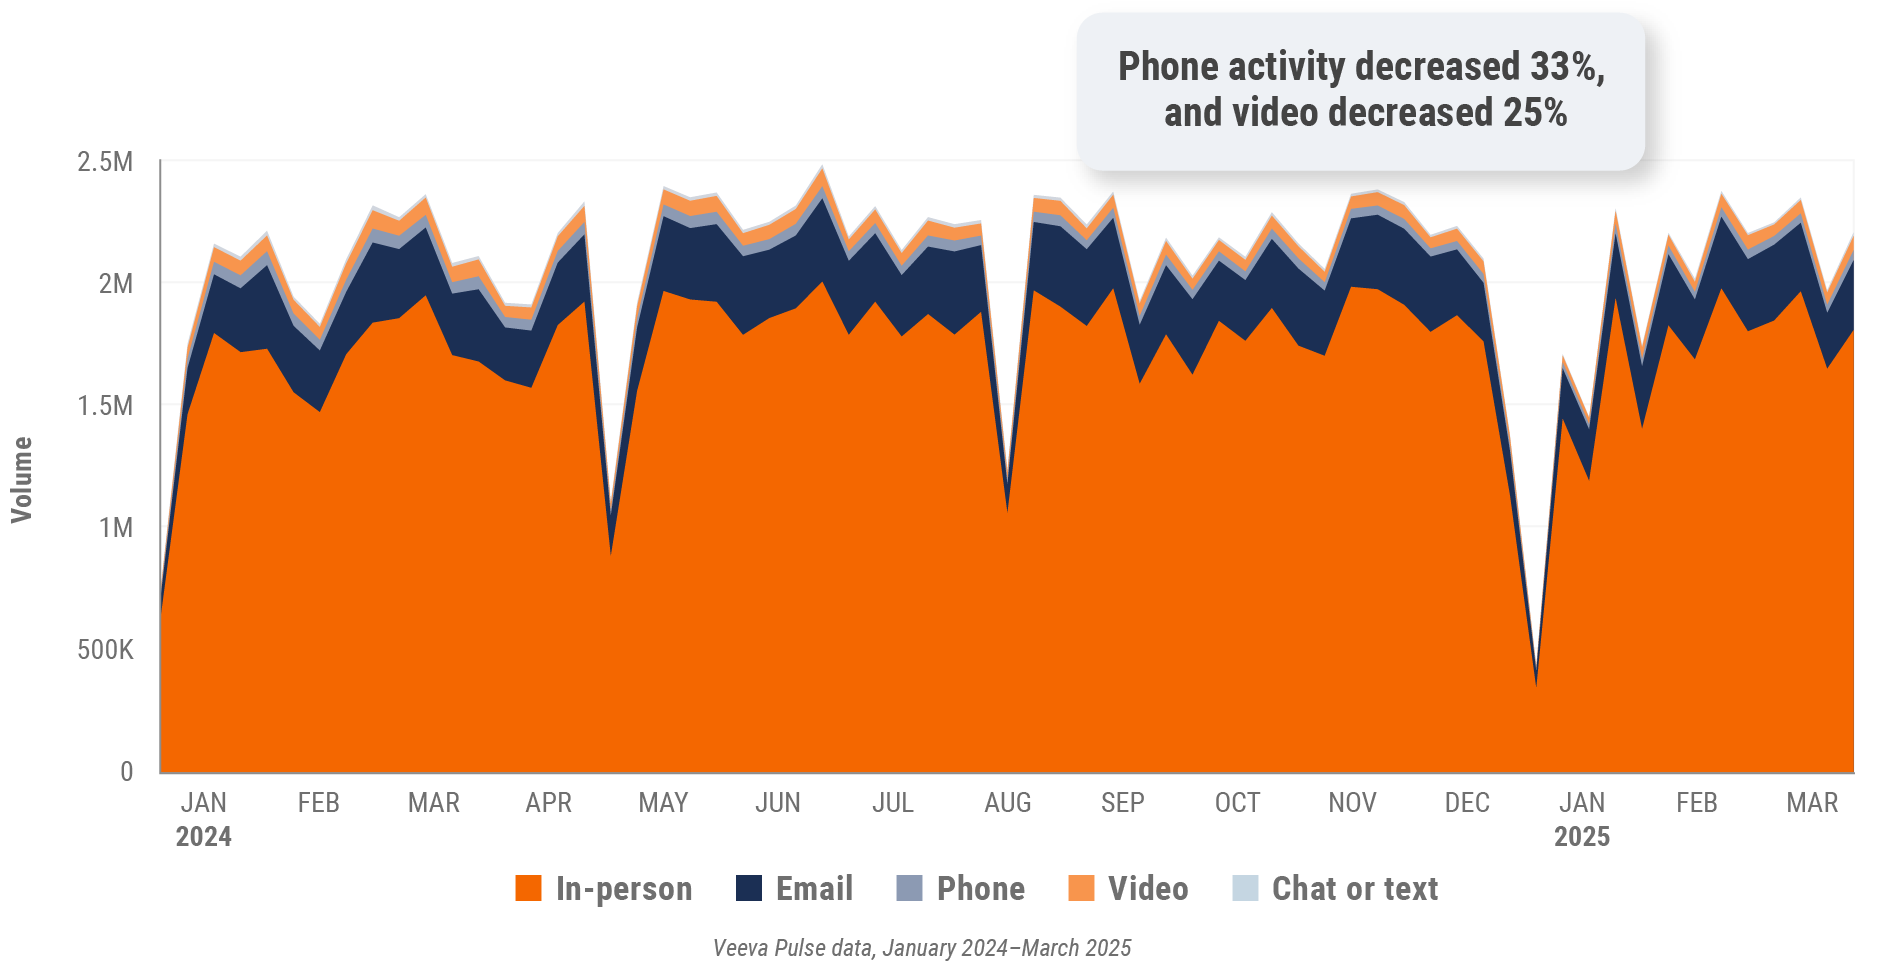
Figure 20: Channel mix, Asia
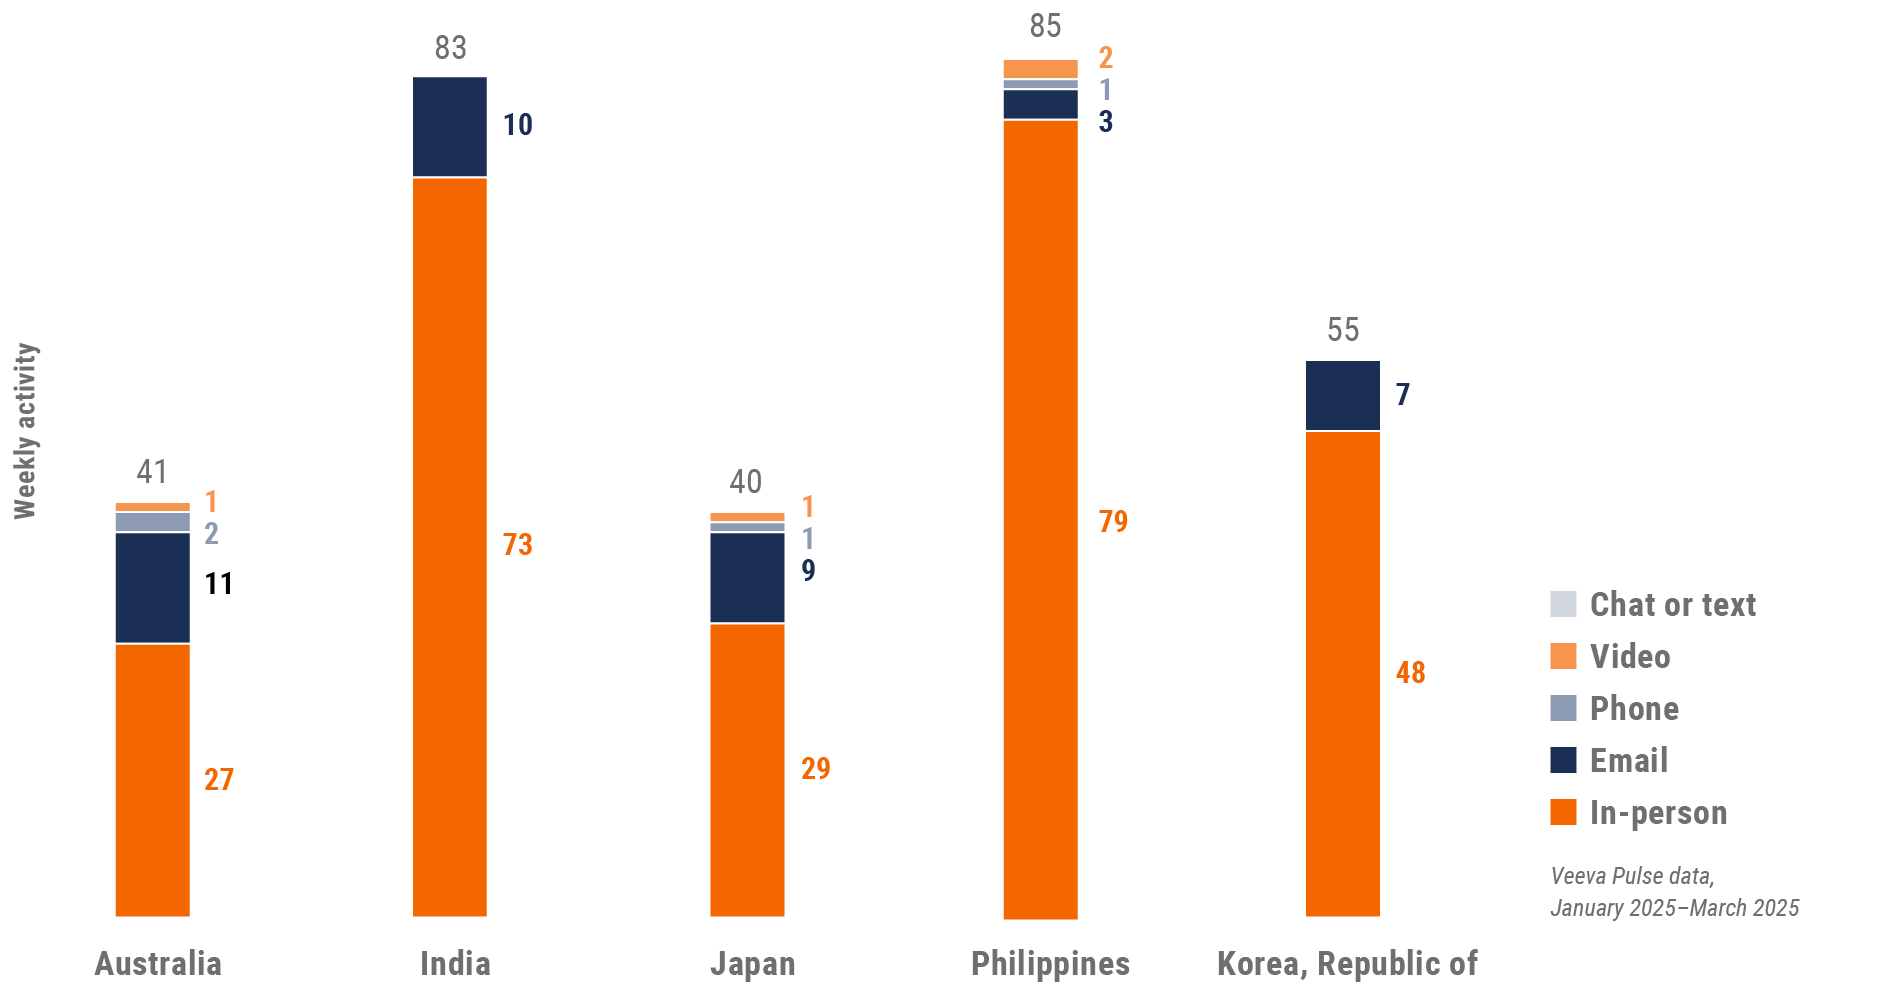
Asia field team activity
Weekly activity per user by engagement channel
Figure 21: Activity by country, Asia
Asia engagement quality
Consolidation of key quality metrics
Figure 22: Approved email volume, Asia
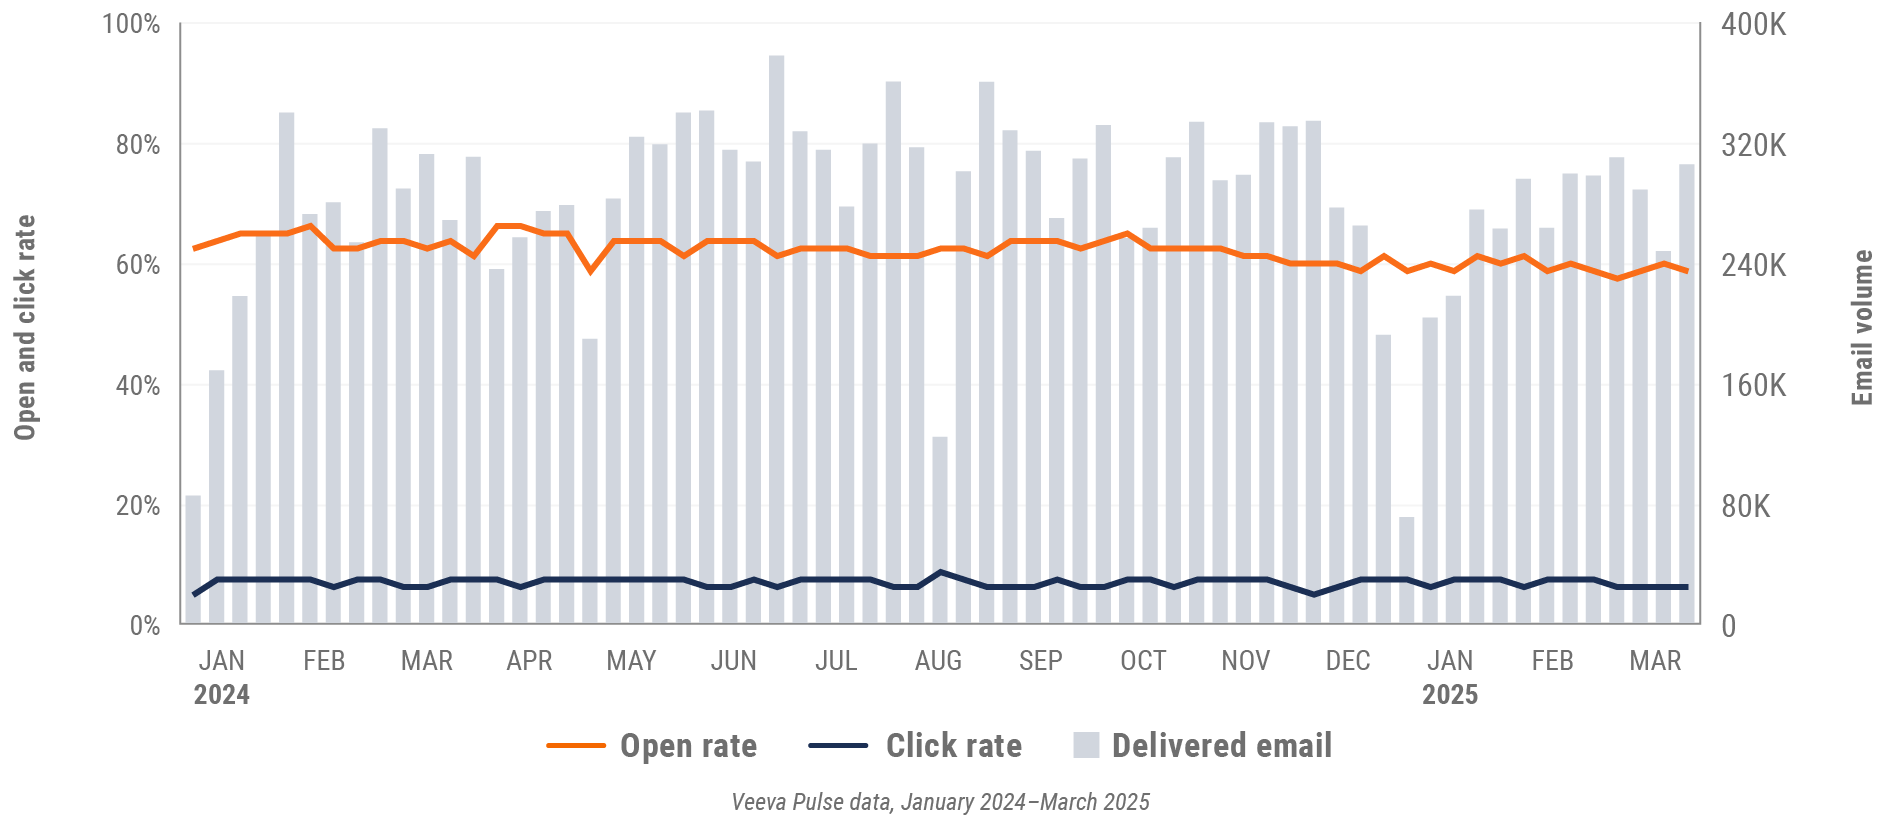
Figure 23: Content usage by channel, Asia
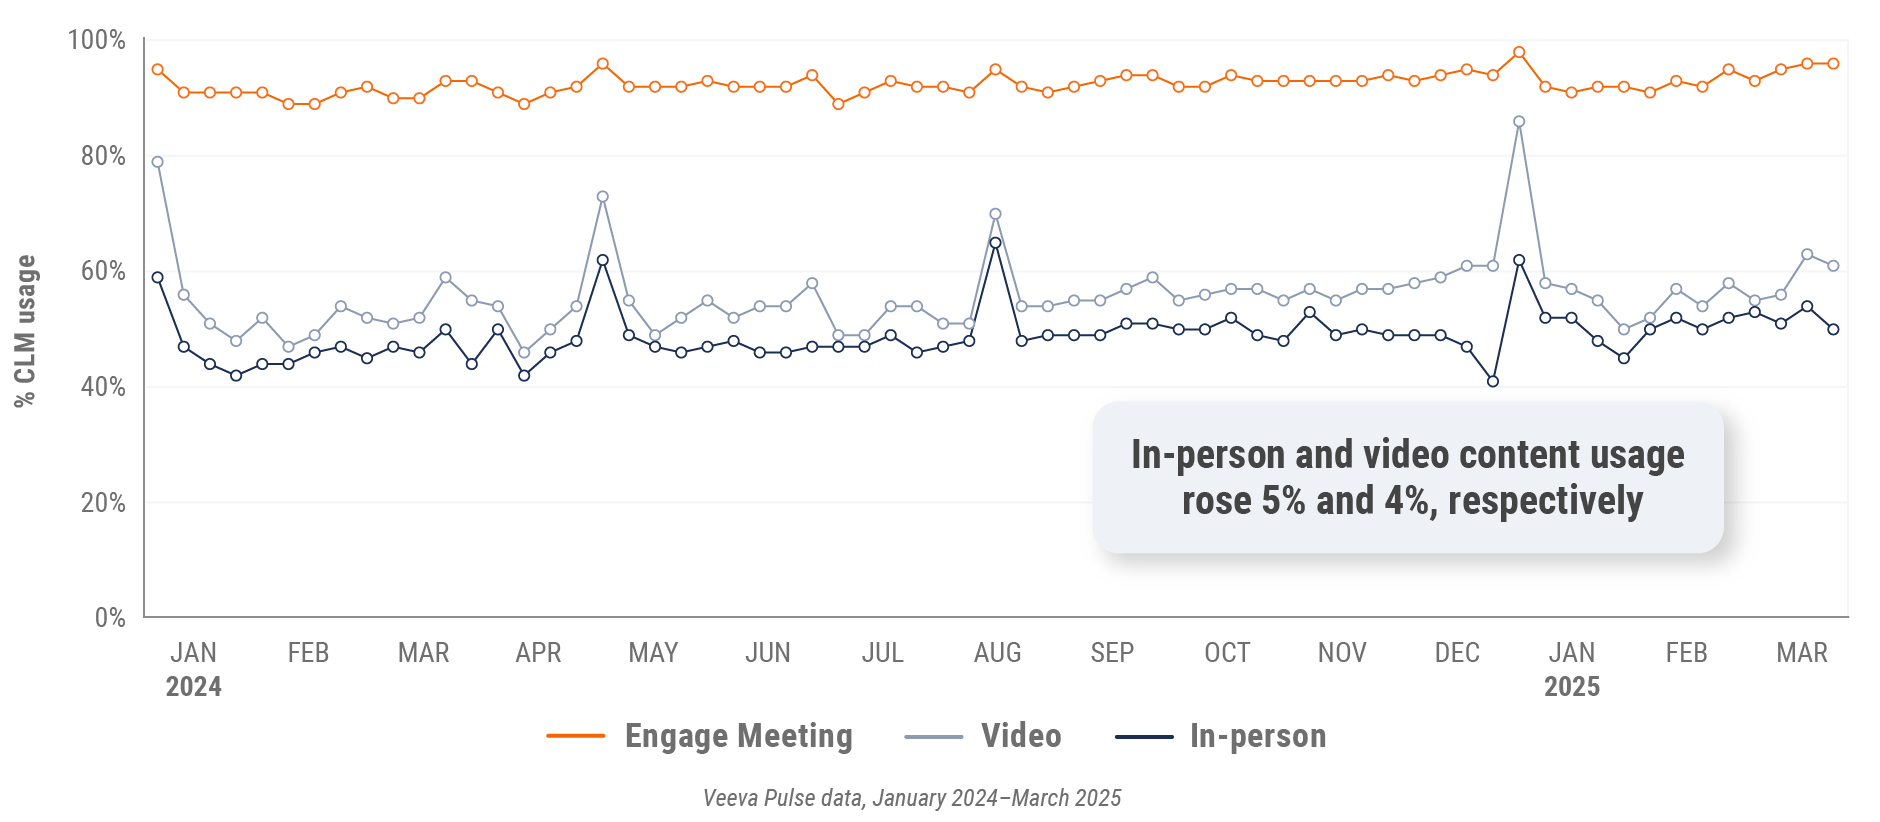
Figure 24: Veeva CRM Engage meeting duration, Asia

Latin America market trends
Figure 25: Channel mix evolution, Latin America
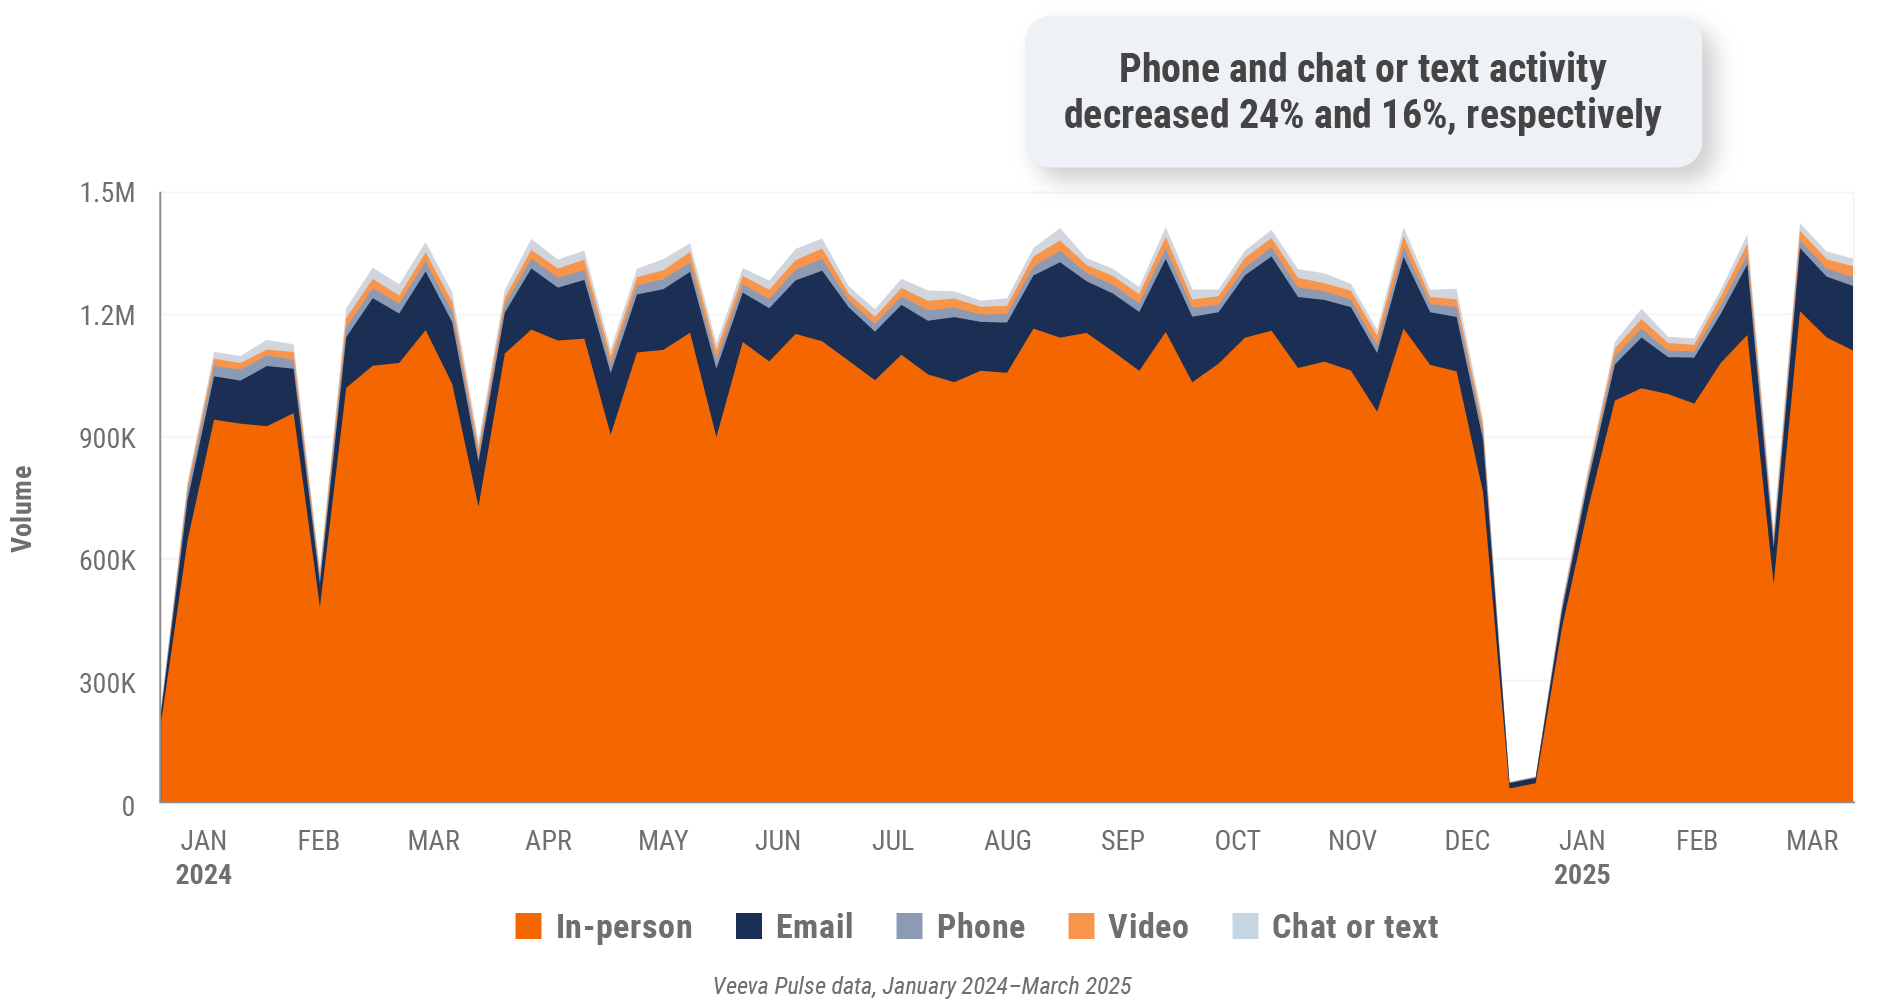
Figure 26: Channel mix, Latin America
Latin America field team activity
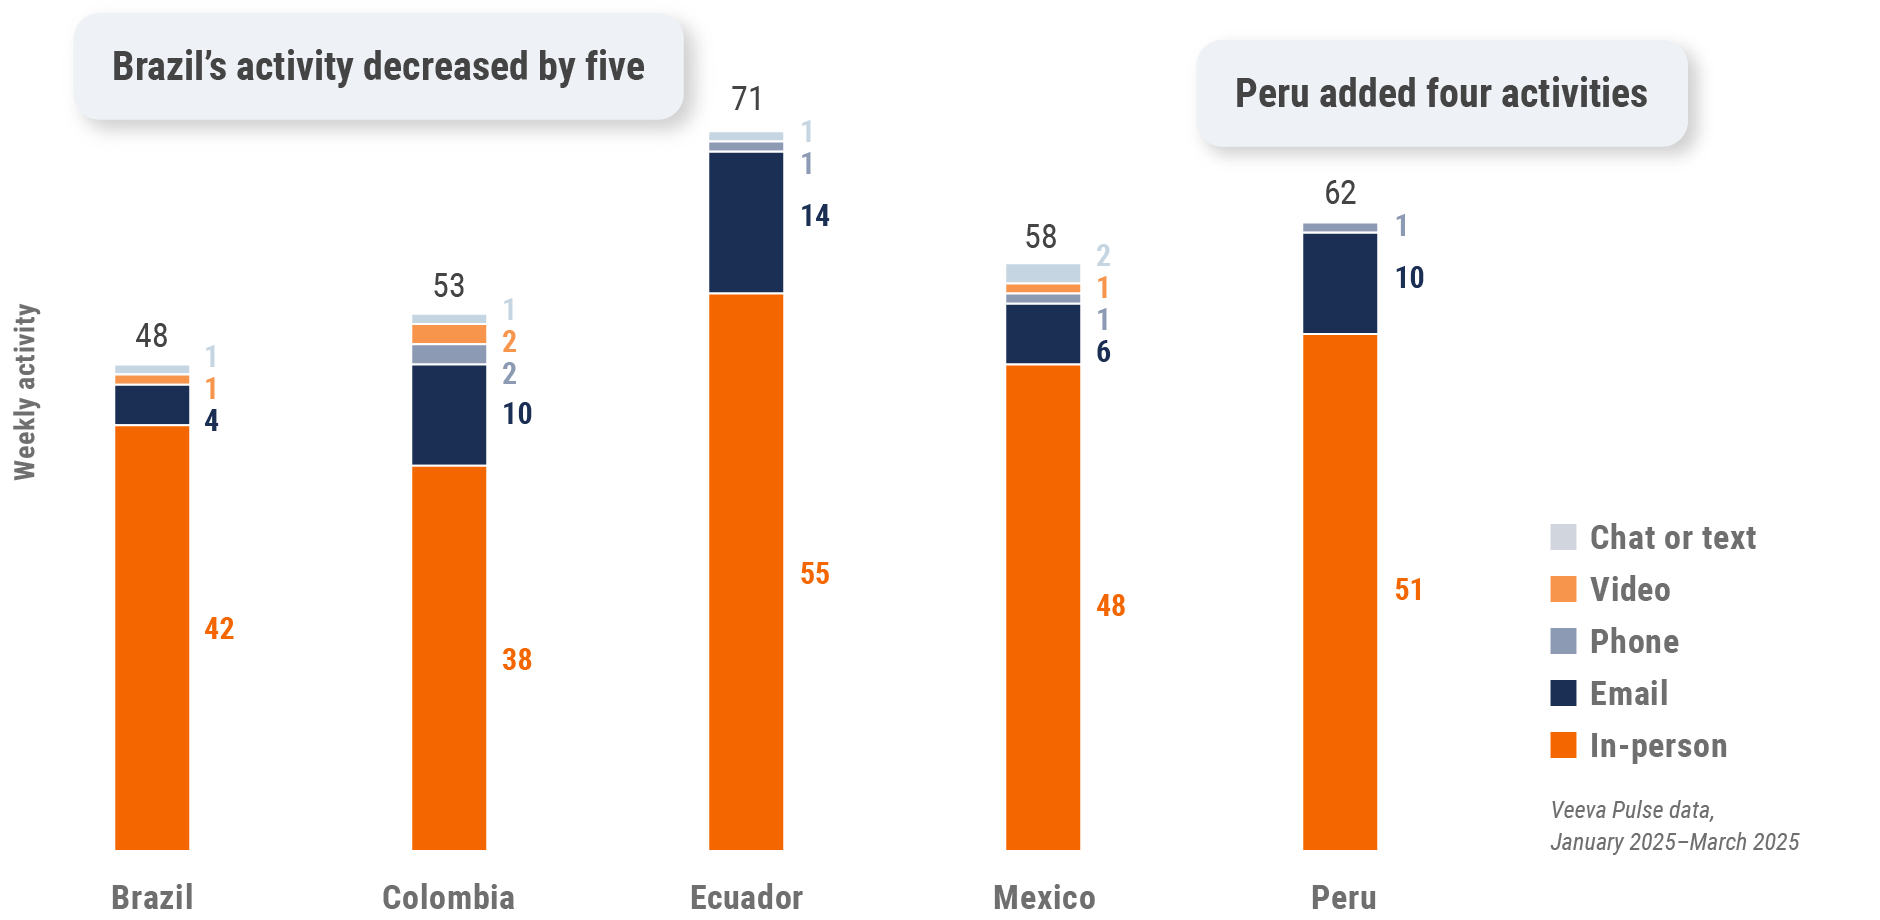
Weekly activity per user by engagement channel
Figure 27: Activity by country, Latin America
Latin America engagement quality
Consolidation of key quality metrics
Figure 28: Approved email volume, Latin America
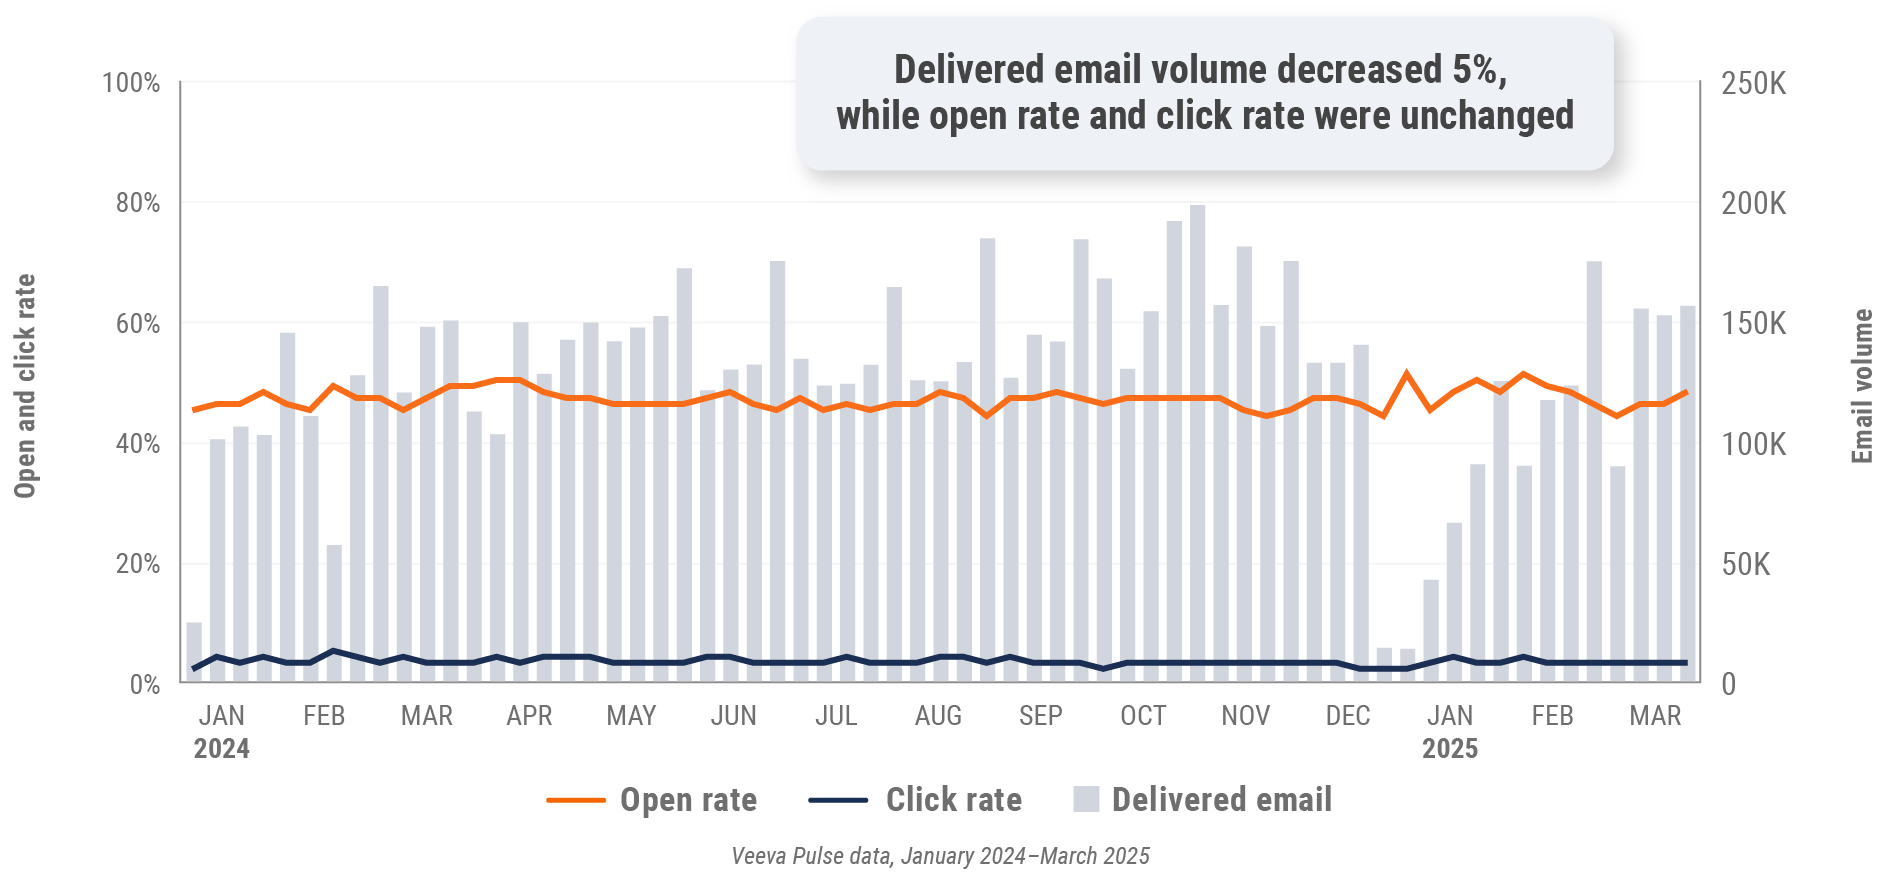
Figure 29: Content usage by channel, Latin America
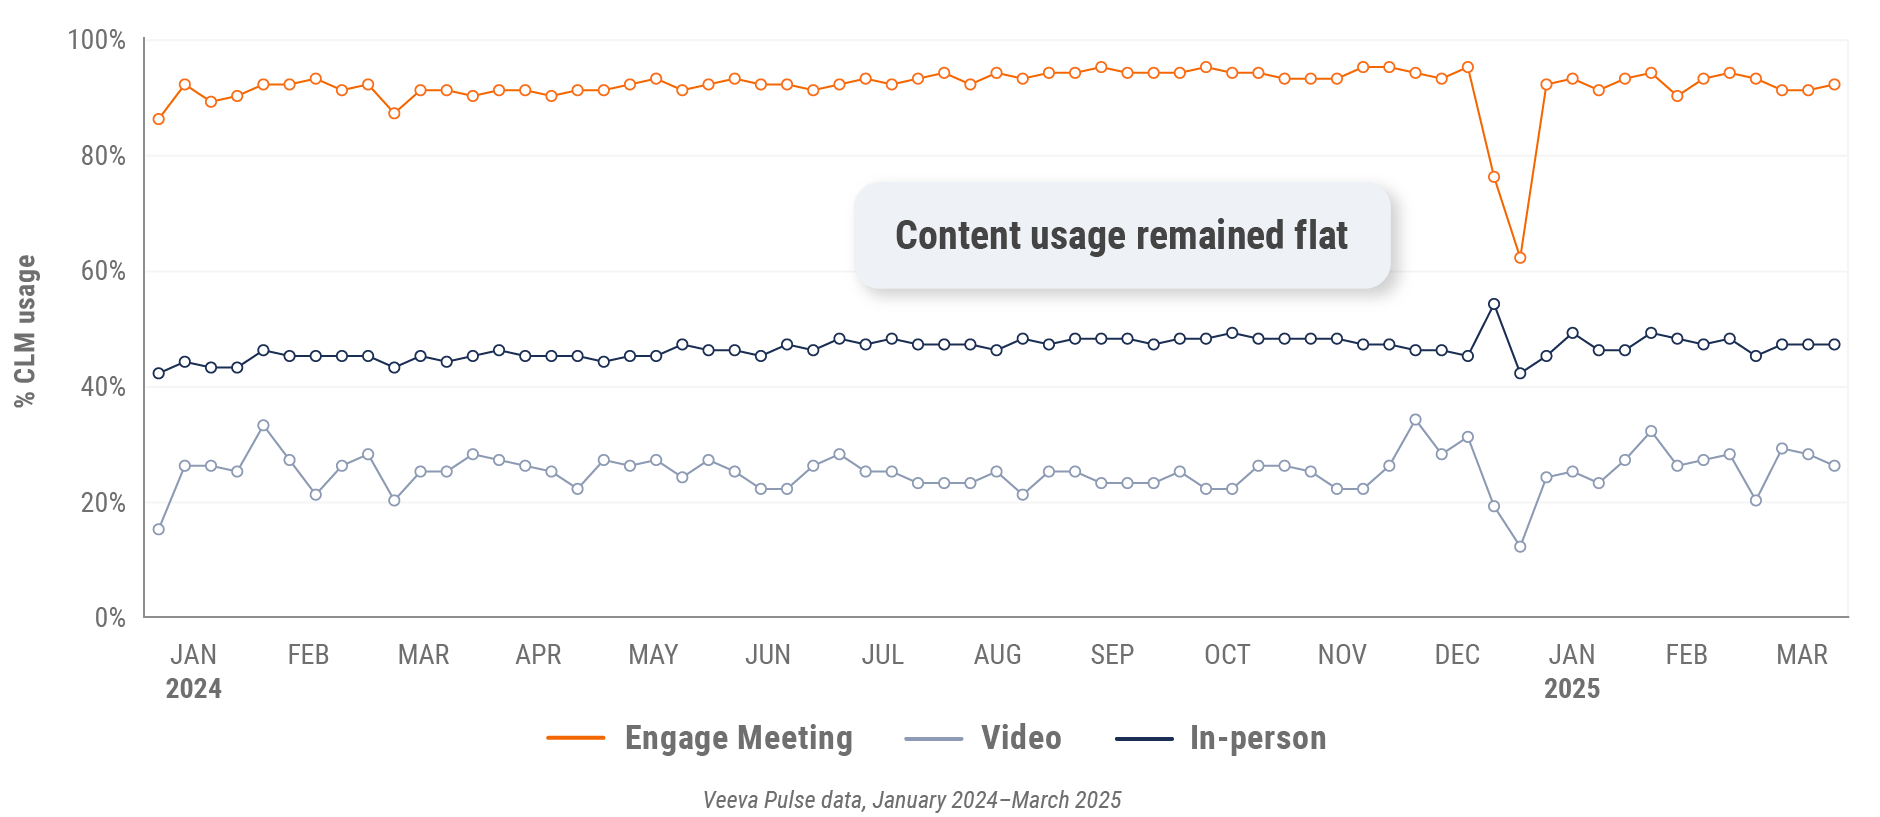
Figure 30: Veeva CRM Engage meeting duration, Latin America

Appendix: Data dictionary
Metric definitions
- Channel mix evolution over time: Weekly Veeva CRM activity volume broken down by the channel of engagement (in-person, phone, video, email, chat or text)
- Channel mix: Total Veeva CRM activity volume broken out by engagement channel percentage, calculated using percent change during the specified period
- Weekly activities per user: The average weekly number of Veeva CRM activities submitted per number of users active in Veeva CRM
- Approved email volume: The average weekly volume of approved emails sent via Veeva CRM, calculated using percent change during the specified period
- Email open rate: Percentage of approved emails opened at least once out of all approved emails sent via Veeva CRM
- Email click rate: Percentage of approved emails clicked at least once out of all approved emails sent via Veeva CRM
- In-person % CLM usage: Percentage of in-person engagements that leveraged content in Veeva CRM
- Video % CLM usage: Percentage of video engagements that leveraged content in Veeva CRM
- Veeva CRM Engage meeting % CLM usage: Percentage of Veeva CRM Engage meetings that leveraged content in Veeva CRM
- Veeva CRM Engage meeting duration: The average duration of Veeva CRM Engage meetings in minutes
Engagement channel definitions
- In-person: Submitted calls with a CRM Standard Metrics call channel value of ‘in-person’
- Phone: Submitted calls with a CRM Standard Metrics call channel value of ‘phone’
- Video: Veeva CRM Engage calls and video calls via other platforms that are then recorded as calls in Veeva CRM with a Standard Metrics call channel value of ‘video’
- Email: Approved emails and emails sent via other platforms that are then recorded as calls in Veeva CRM with a Standard Metrics call channel value of ‘email’
- Chat or text: Submitted calls with a CRM Standard Metrics call channel value of ‘chat or text’
Region definitions
- Global: All markets globally. This quarter’s global trends report omits data from China.
- Europe: Albania, Andorra, Armenia, Aruba, Austria, Azerbaijan, Belarus, Belgium, Bermuda, Bosnia and Herzegovina,
Bulgaria, Croatia, Cyprus, Czech Republic, Denmark, Estonia, Finland, France, French Polynesia, Georgia, Germany,
Greece, Greenland, Guadeloupe, Guernsey, Hungary, Ireland, Italy, Jersey, Latvia, Lithuania, Luxembourg, Macedonia,
Malta, Martinique, Republic of Moldova, Monaco, Montenegro, Netherlands, New Caledonia, Norway, Poland, Portugal,
Romania, Serbia, Slovakia, Slovenia, Spain, Sweden, Switzerland, Ukraine, United Kingdom - Asia: Australia, Bangladesh, Bhutan, Brunei Darussalam, Cambodia, Cocos (Keeling) Islands, Indonesia, Japan,
Kazakhstan, Republic of Korea, Kyrgyzstan, Malaysia, Mongolia, Myanmar, Nauru, Nepal, New Zealand, Philippines,
Samoa, Singapore, Solomon Islands, Sri Lanka, Taiwan, Tajikistan, Thailand, Turkmenistan, Uzbekistan, Vietnam - Latin America: Antigua and Barbuda, Argentina, Bahamas, Barbados, Belize, Bolivia, Brazil, Chile, Colombia, Costa
Rica, Cuba, Dominican Republic, Ecuador, El Salvador, Guatemala, Guyana, Haiti, Honduras, Jamaica, Mexico,
Nicaragua, Panama, Paraguay, Peru, Trinidad and Tobago, Uruguay, Venezuela
Methodology
The Veeva Pulse Field Trends Report is a quarterly industry benchmark for global and regional healthcare
professional (HCP) engagement across the life sciences industry. The findings are based on:
- Approximately 600 million annual global field activities captured in Veeva CRM and Veeva CRM Engage.
- Marketing effectiveness data from Veeva Crossix. Crossix connects anonymized health data on 300+ million patients to media data to measure the impact of direct-to-consumer and HCP marketing investments in the U.S.
- Anonymous patient longitudinal claims data from Veeva Compass Patient covering dispensed prescriptions, procedures, and diagnoses from 300+ million patients.
- 4+ million profiles containing publications, clinical trials, conferences, associations, guidelines, grants, payments, social media, news mentions, and patient mix by disease and drug class from Veeva Link Key People in 85+ countries and all major therapeutic areas.
- Global reference data of HCPs, healthcare organizations, and affiliations from Veeva OpenData, containing addresses, emails, specialties, demographics, and compliance data (license information and industry identifiers) in 100+ countries.
The Veeva Pulse Field Trends Report delivers insights that inform the industry and help field teams align their
strategy to key market trends for improved commercial success. The global Veeva Business Consulting team also
helps customers inform their strategies using industry benchmarking with Veeva Pulse data.