Treatment Adoption is 40% Faster with Targeted Scientific Outreach
Engaging digitally savvy, early-career HCPs amplifies impact
Challenging disease states, innovative new medicines, and increasingly complex clinical trials have raised the stakes for
new product launches. Breaking through to healthcare professionals (HCP) with new scientific evidence is a core
challenge, as they contend with huge volumes of information across disparate channels. How biopharmas
communicate scientific evidence is key to maximizing launch success.
Pulse data has shown that pre-launch field medical education improves treatment adoption by 50%. Now, our latest
analysis shows that pre-launch investment in scientific outreach beyond field medical, in forums like congresses, has a
material impact. In an analysis of U.S. oncology drugs, higher levels of pre-launch scientific activity accelerated
treatment adoption by 40%. These findings underscore the quantifiable impact that targeted medical affairs strategies
have on launch success.
Read our analysis to learn how pre-launch investment in scientific outreach sets the stage for faster treatment adoption
and, ultimately, commercial success at launch and beyond.
Thank you,

Dan Rizzo
Global Head of Veeva Business Consulting

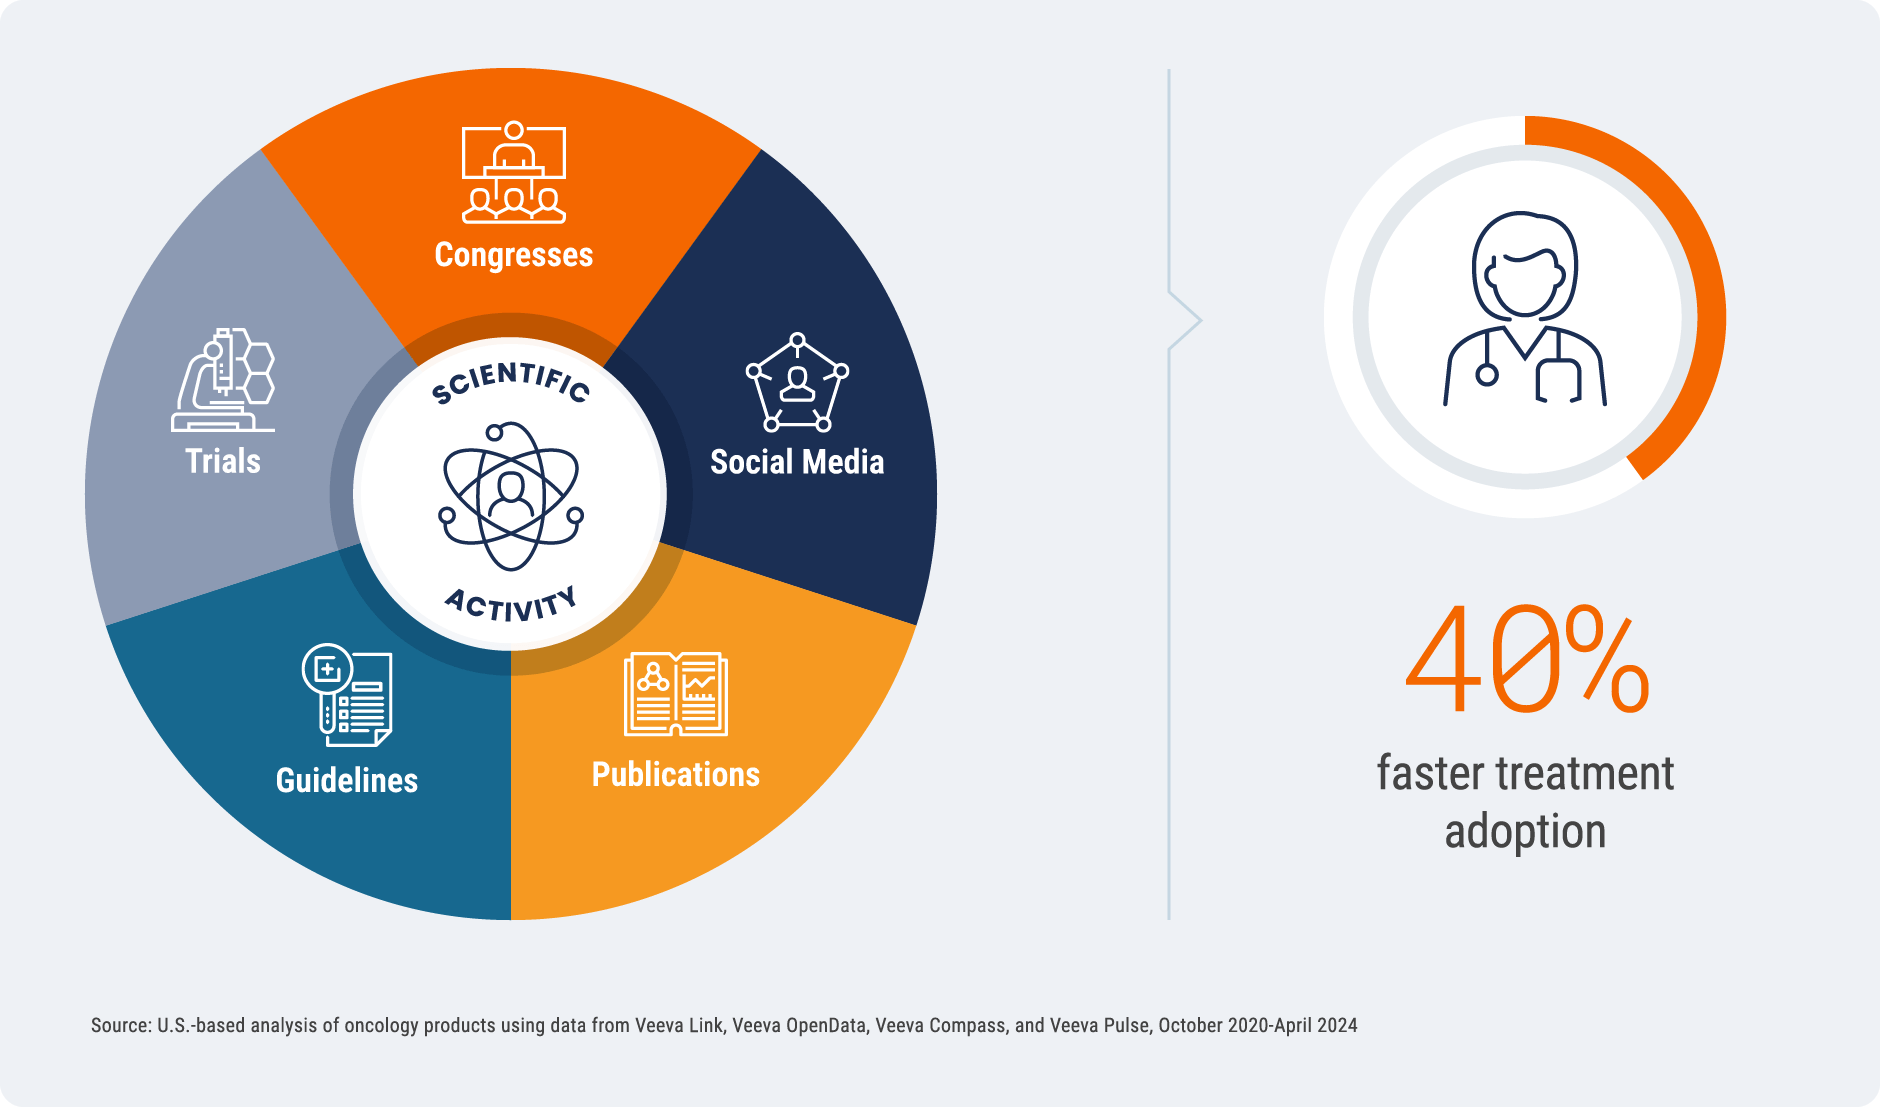
Pre-launch scientific outreach accelerates treatment adoption by 40%
In a study of oncology drugs in the U.S., biopharmas that invested more in pre-launch scientific
activities, e.g., congresses, clinical trials, and publications, saw 40% faster treatment adoption than
biopharmas that invested less. A robust pre-launch scientific communications strategy optimizes
launch success by meeting HCPs and other experts where they are, on their terms.
Pre-launch field medical education improves treatment adoption by 50%. By connecting medical
affairs HQ and field medical activity and measuring impact during this critical window,
biopharmas can create the best opportunity to influence treatment adoption.
Defining scientific activity:
Non-promotional medical or scientific initiatives, including congresses, social media activity, publications,
guidelines, and clinical trials
Impact of Pre-Launch Scientific Outreach
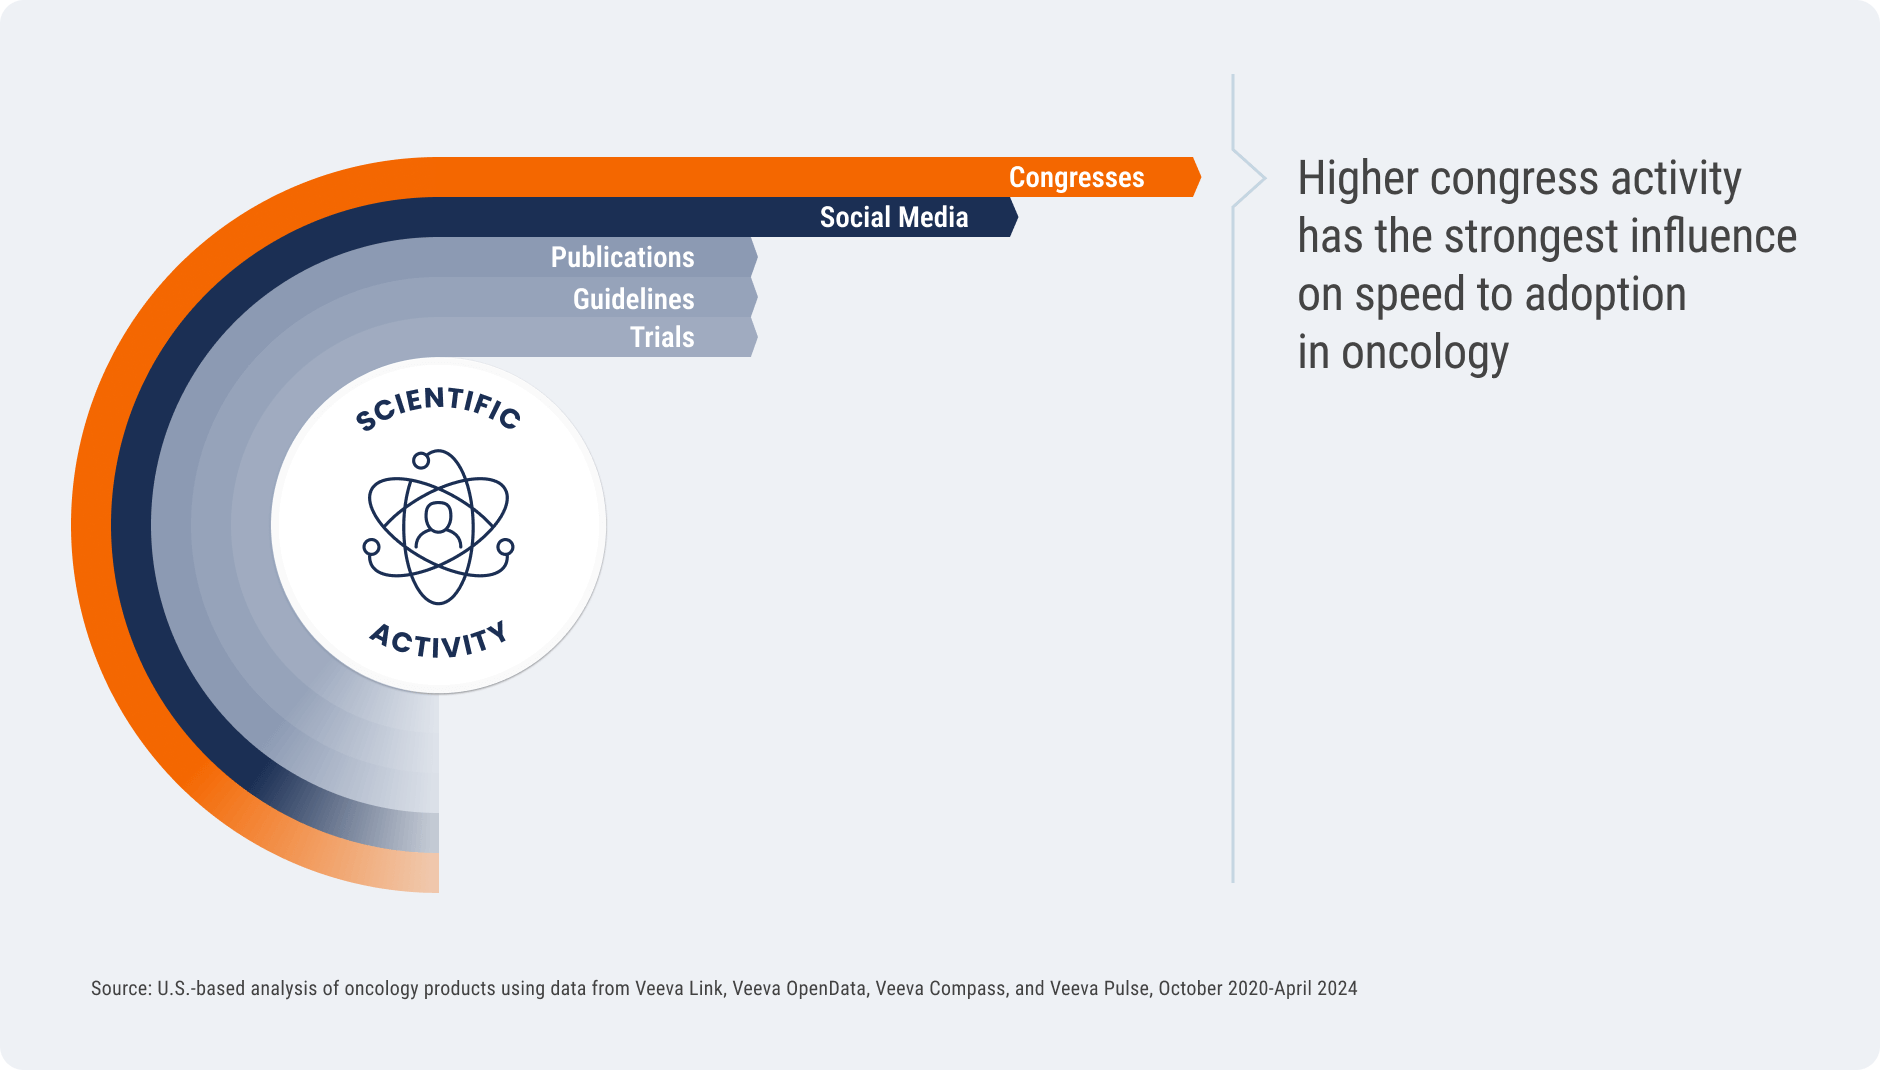
Congress activity has the strongest influence on speed of adoption
Not all channels of scientific activity are created equal — how biopharmas reach experts can have
a measurable impact on success. Across the oncology drugs studied, higher investment in
congress activities pre-launch most strongly influenced speed to treatment adoption post-approval.
While clinical trials and publications are important foundational elements of scientific
communication, the analysis found a much lower correlation between these activities and
treatment adoption. Congresses and the digital discussions kicked off by those events (e.g.,
discussions on social media) create a halo effect that amplifies scientific information. Deep data
on KOLs and other experts can help medical affairs understand which congresses present the
best opportunity to drive scientific engagement.
Not All Channels Are Created Equal
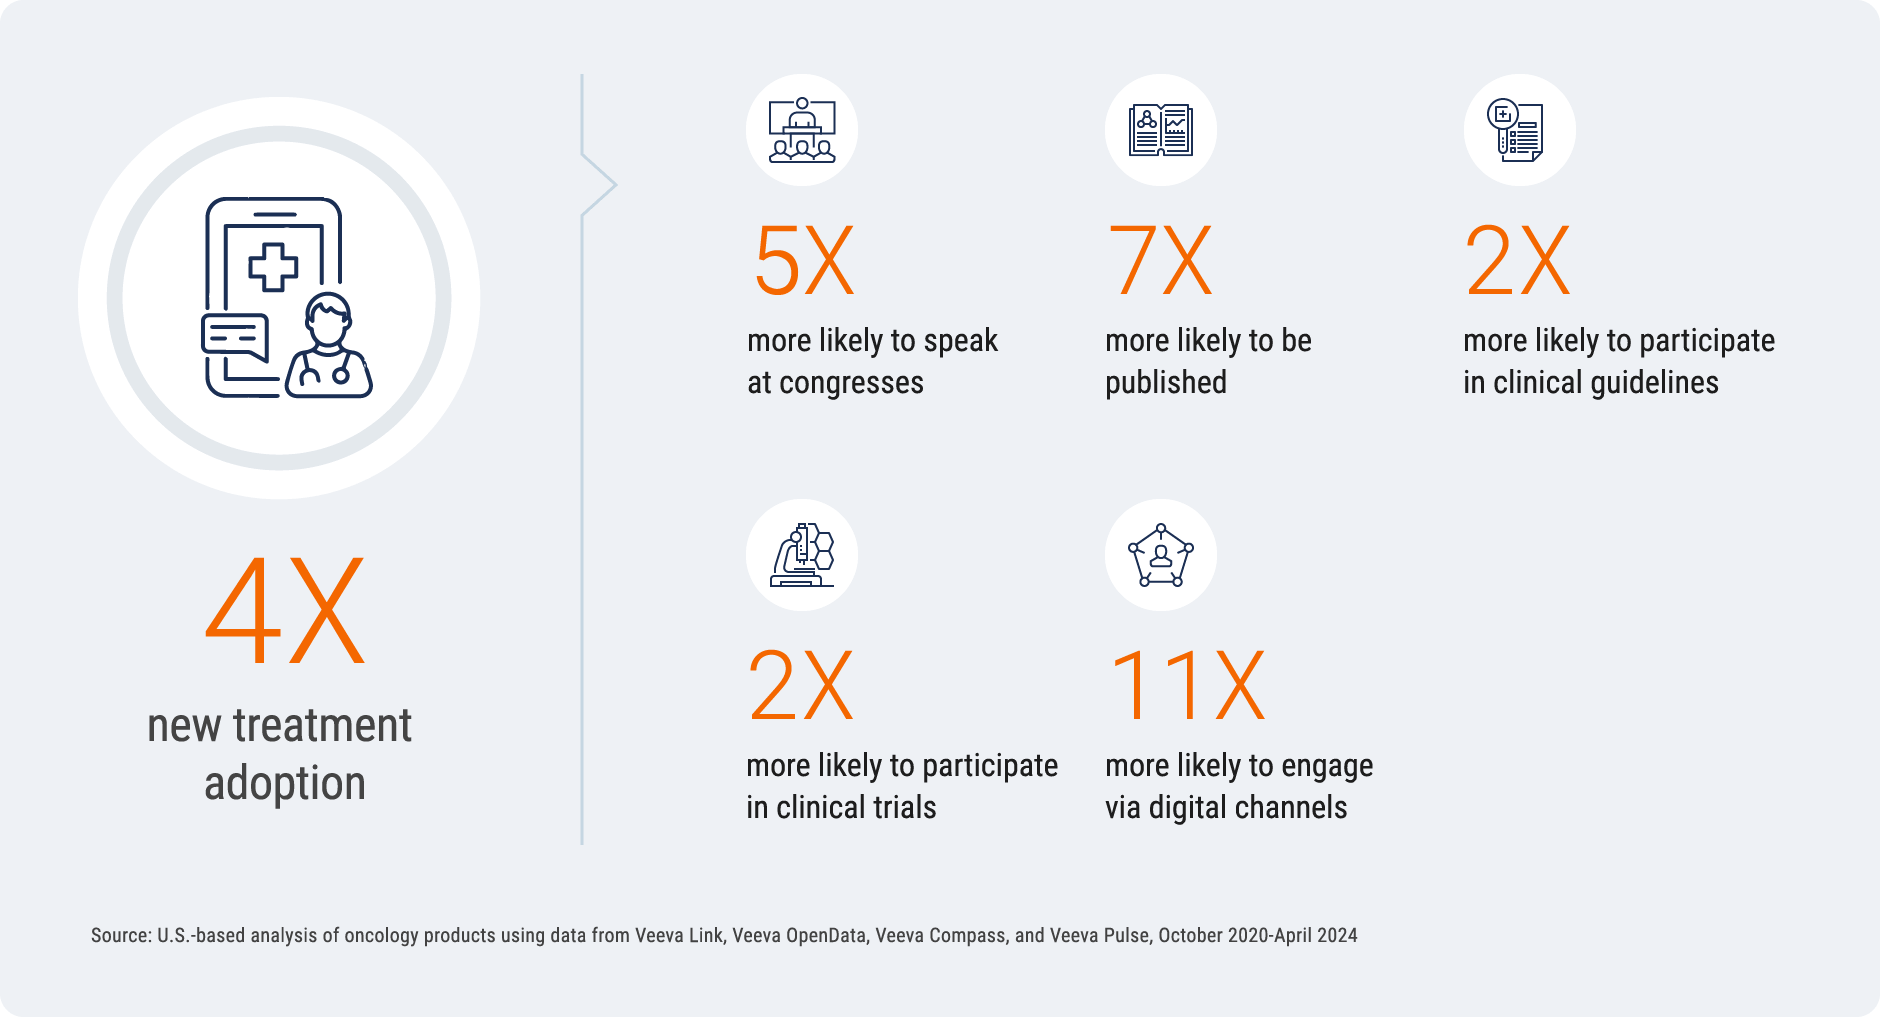
Digitally savvy, early-career HCPs are four times more likely to adopt
a new treatment
There is significant untapped potential in early-career HCPs, who are 15 years younger, digitally
savvy, and more scientifically active than their peers. The analysis found that these emerging
experts are four times more likely to adopt a new treatment.
“Gone are the days when medical could just focus on the top-tier scientific thought leaders.
The range of stakeholders has broadened, and it’s imperative to expand our engagement
strategies beyond traditional experts.”
Angela Smart, Director of Global Medical Excellence and Operations at ADVANZ PHARMA
Deep data on activities like congresses, social media posts, and publications can help identify,
prioritize, and engage these experts. Understanding this demographic’s digital and scientific
behaviors, in addition to investing in the right scientific channels, can maximize treatment
adoption.
Untapped Potential of Digitally Savvy, Early-Career HCPs
Biopharmas have an opportunity to maximize launch success by:
- Coordinating the efforts of medical affairs and field medical, including sharing medical insights that improve commercial and clinical decision-making
- Benchmarking investments in scientific outreach, ensuring appropriate resources to support launch strategy, and measuring the ROI of outreach for each disease area
- Using deep data to identify, prioritize, and engage experts with targeted scientific outreach
Reach out to Veeva Business Consulting to learn how you can use Veeva Pulse data to achieve data-driven launch
excellence.
Global and Regional Trends
This report highlights global and regional field engagement trends from Veeva Pulse data gathered between April 2023
and June 2024. Veeva Pulse data is sourced from Veeva’s aggregated CRM activity, including field engagement stats
from all instances of Veeva CRM globally. In this report, all comparisons are year-over-year, Q2 2023 to Q2 2024,
unless otherwise noted.
Global trends*
Figure 1: Channel mix evolution, global
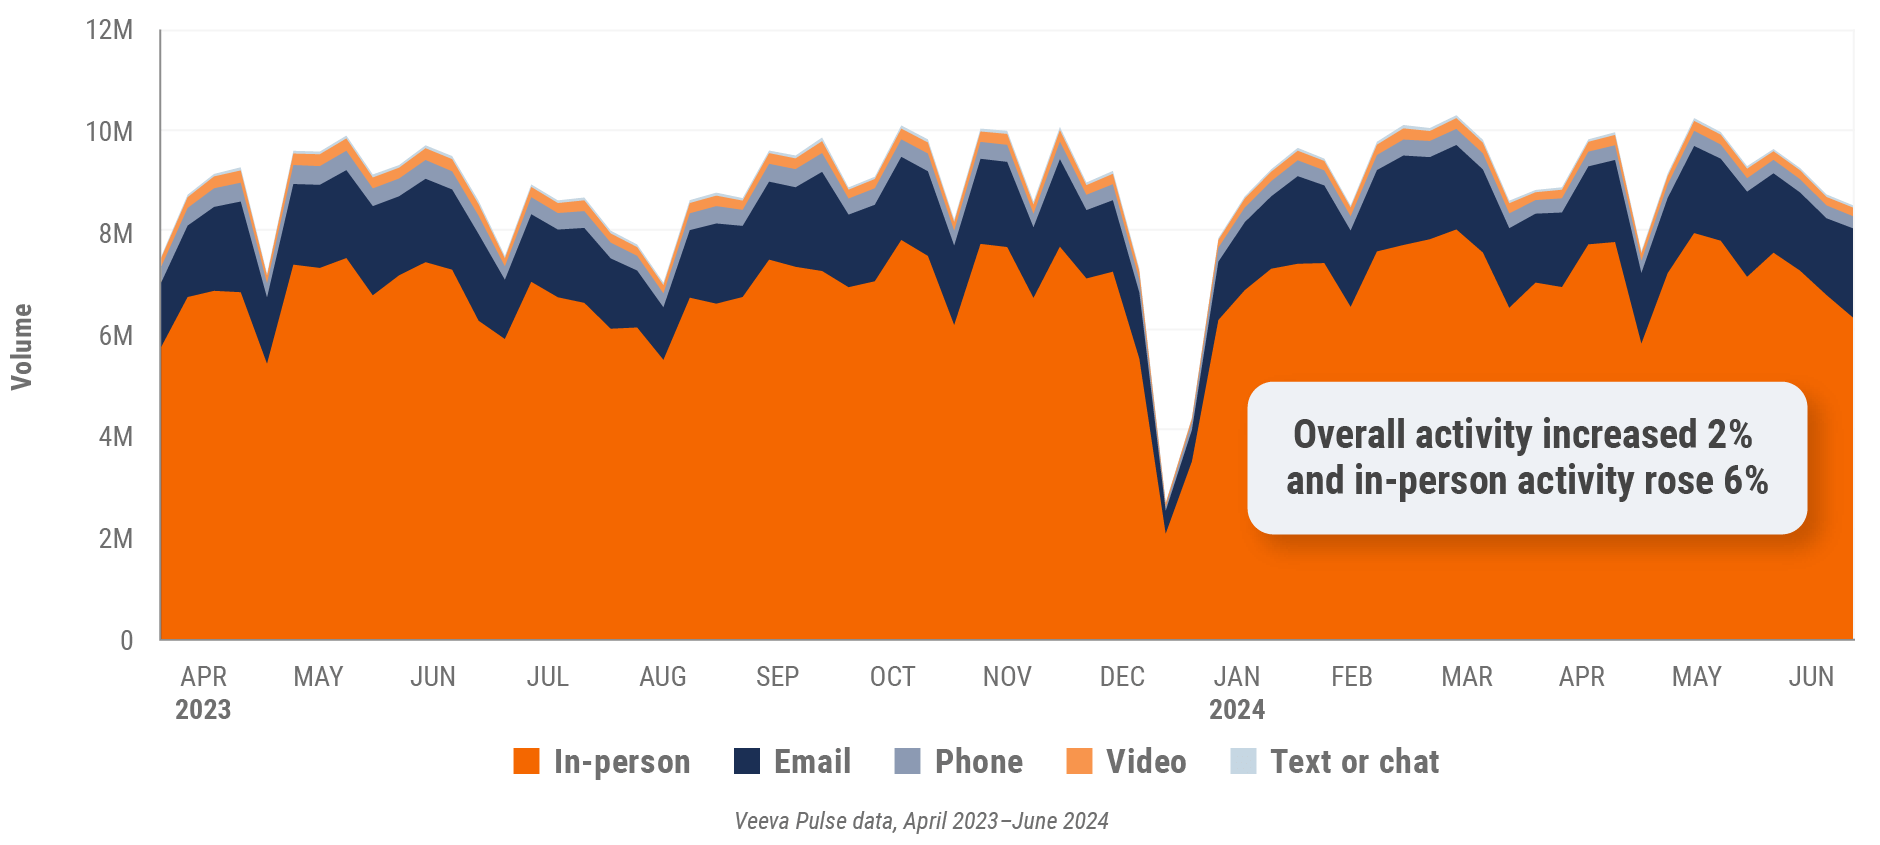
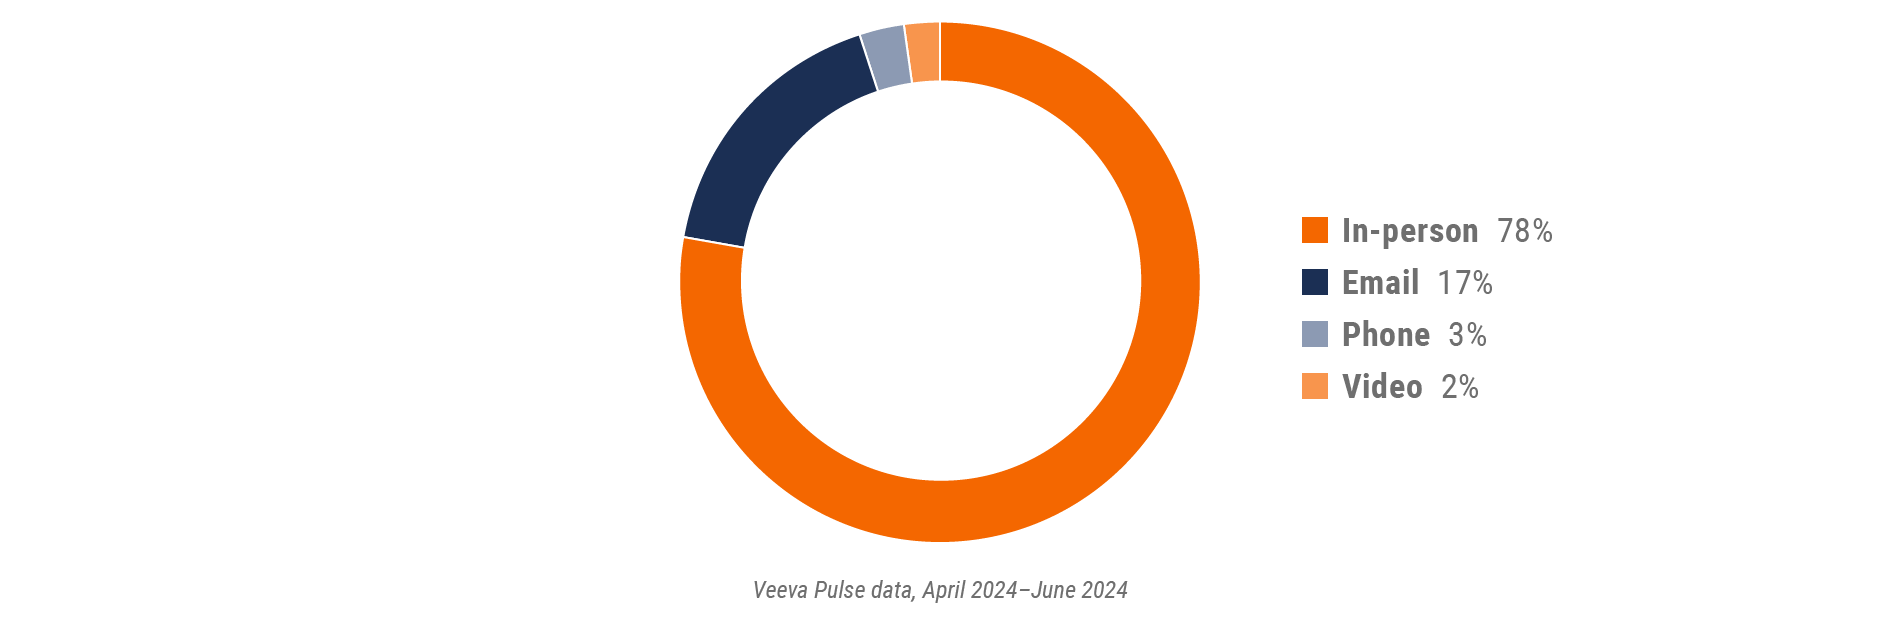
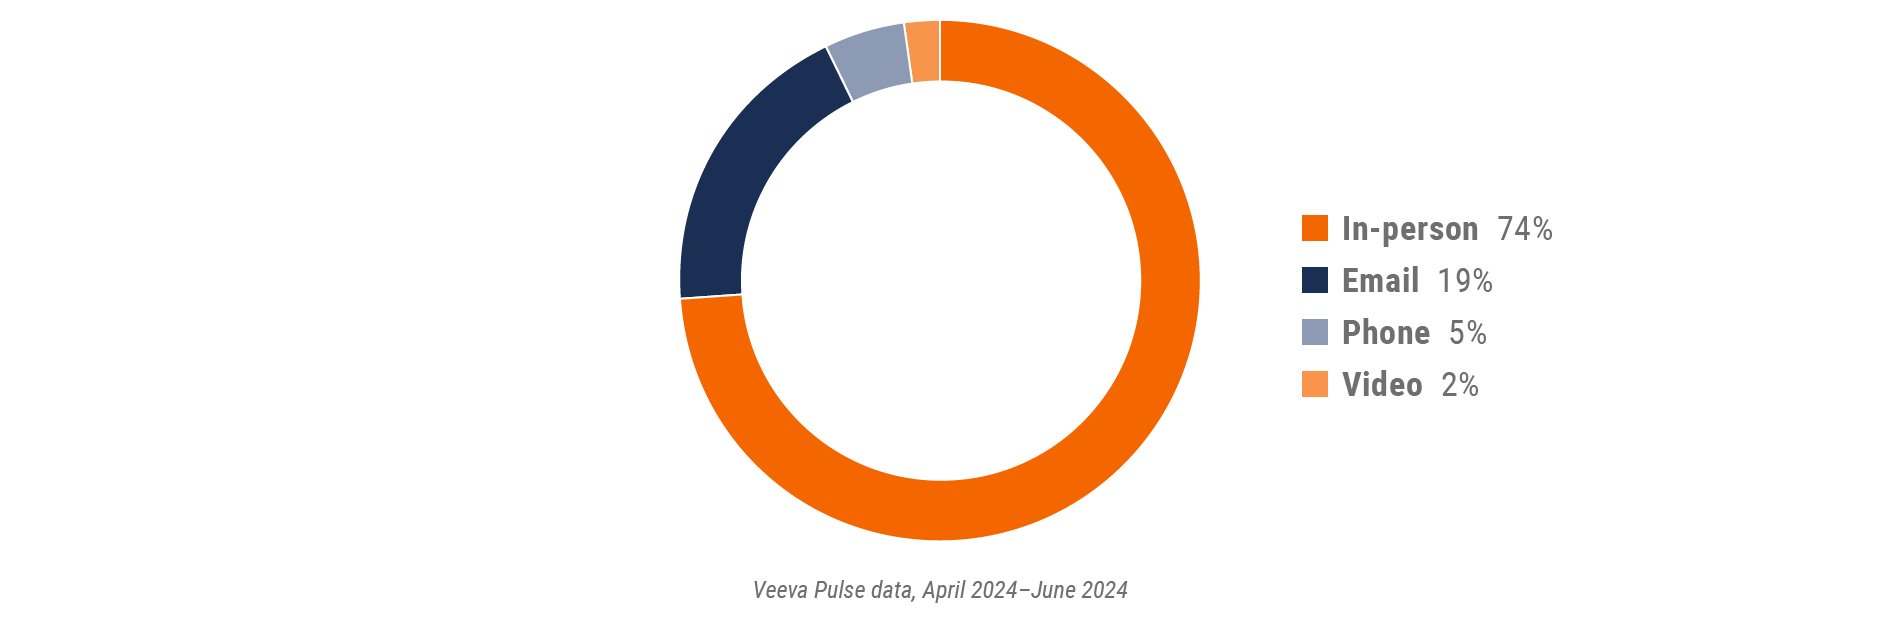
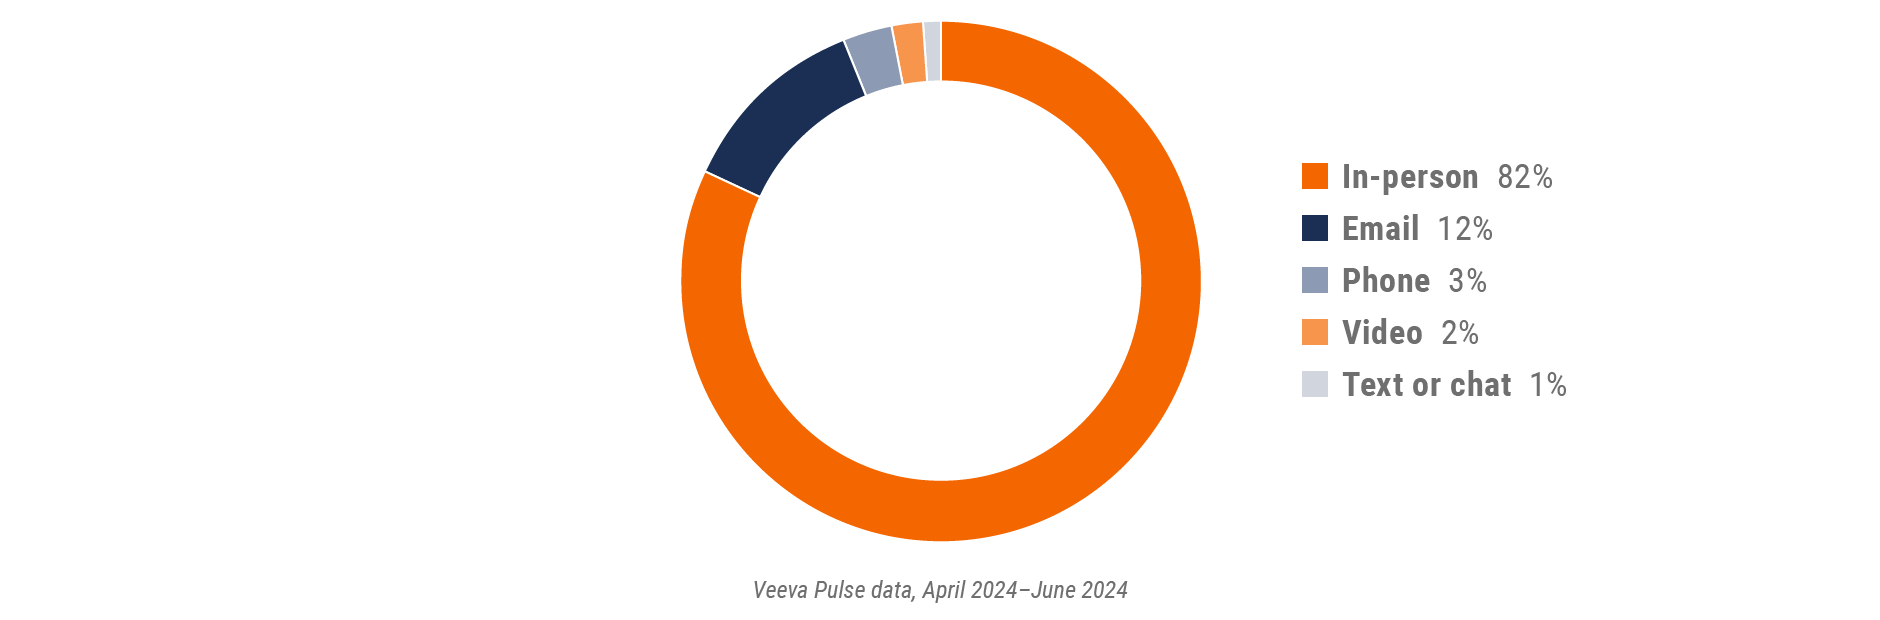
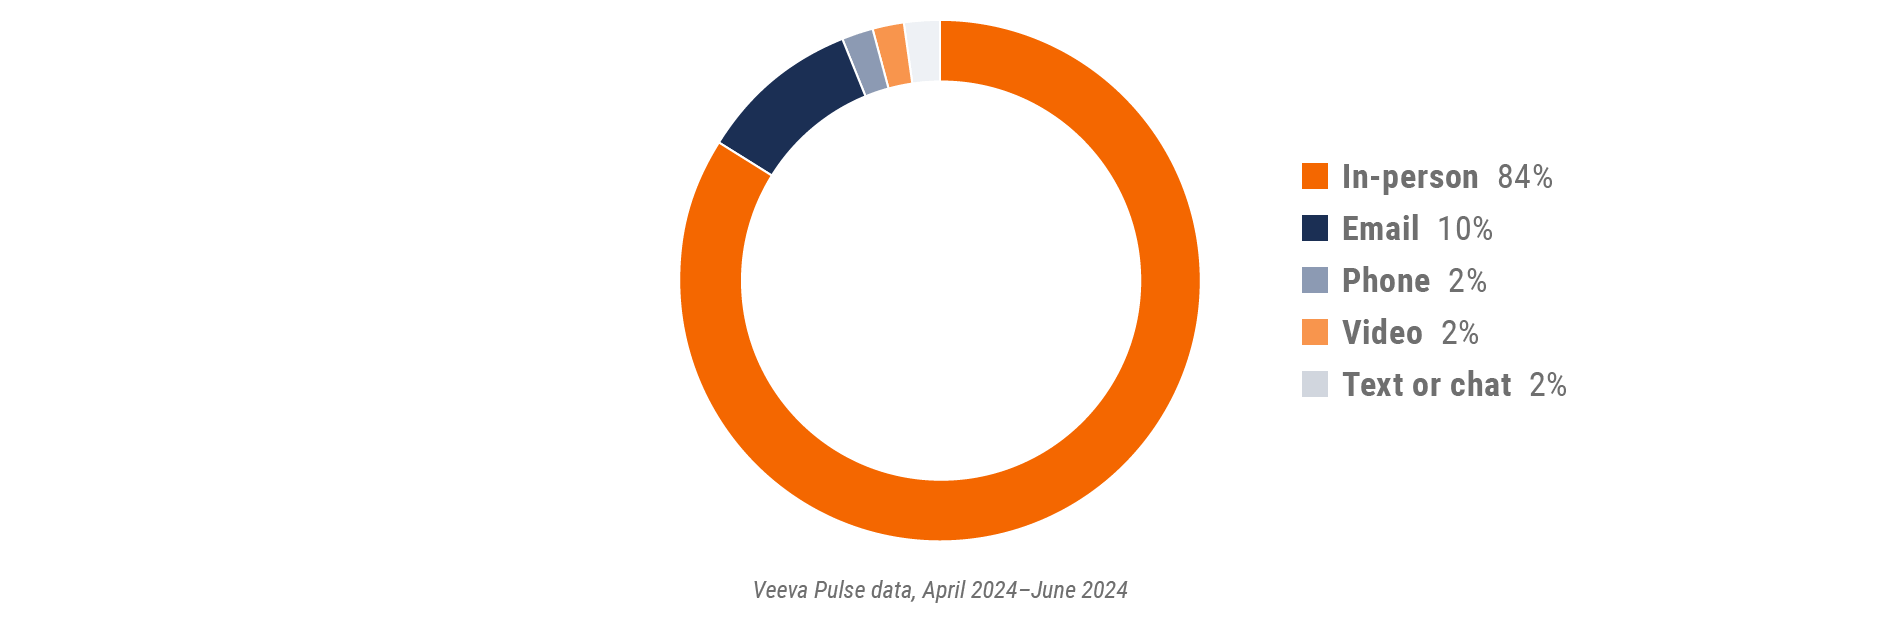
Figure 2: Channel mix, global
Global field team activity
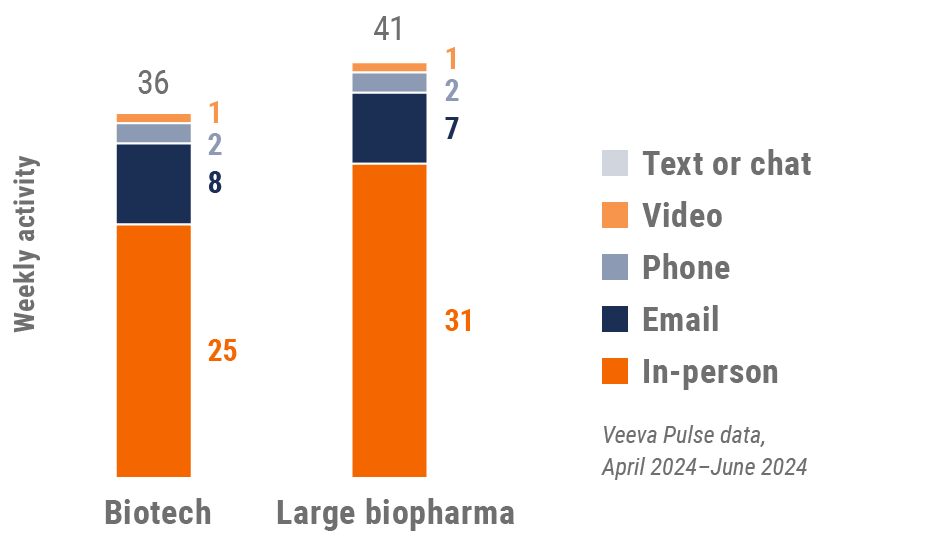
Weekly activity per user by engagement channel
Figure 3: Activity by region, global
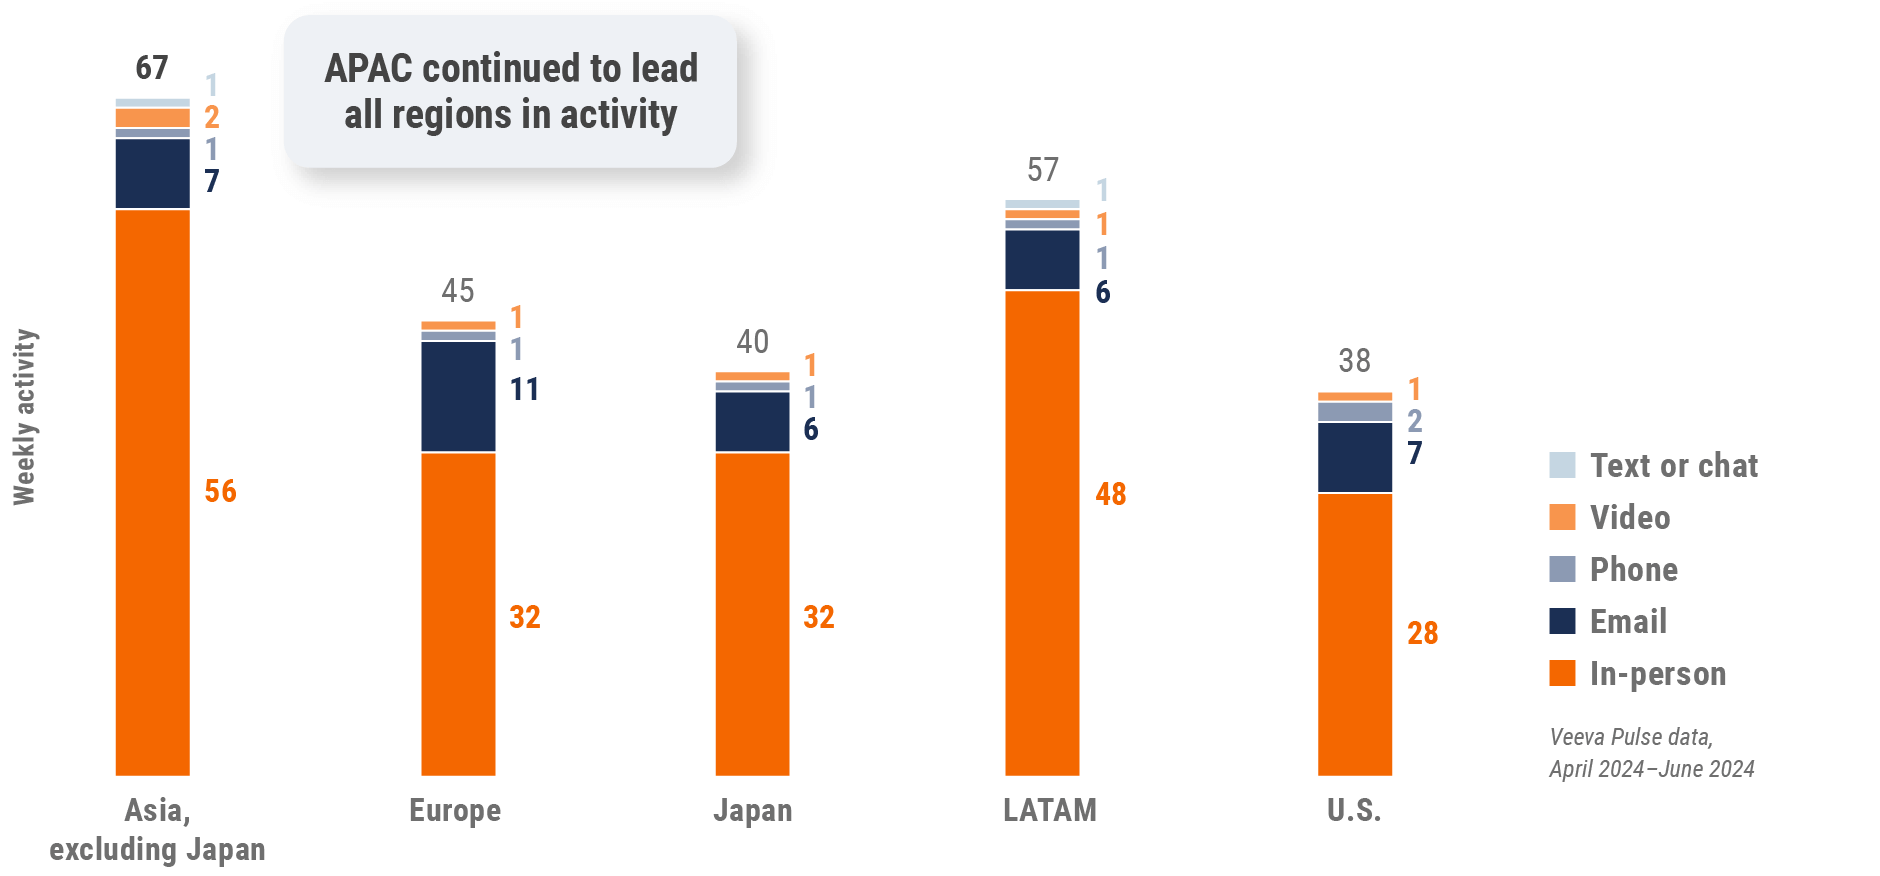
Figure 4: Activity by user type, global
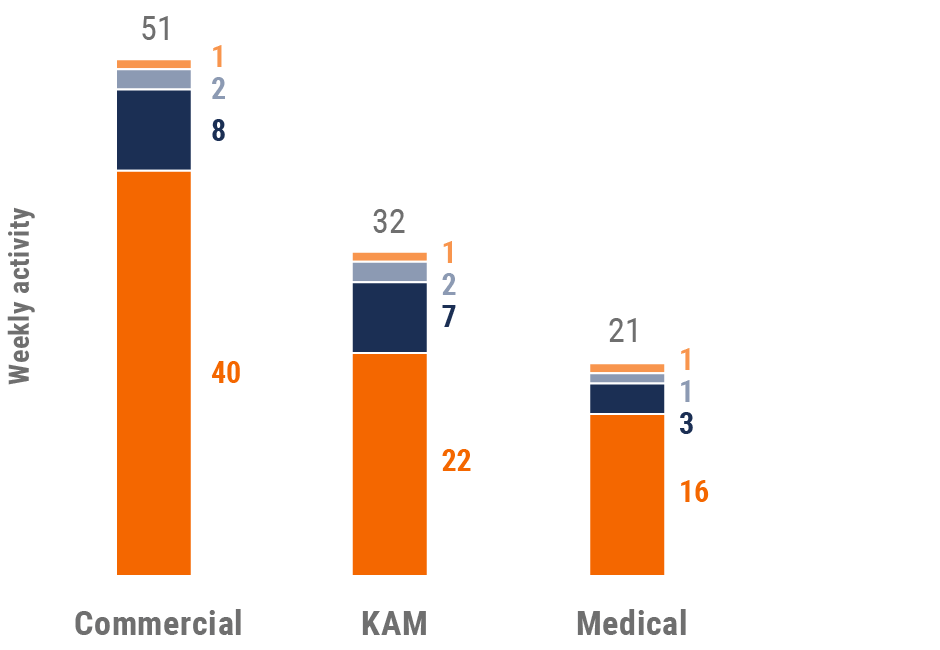
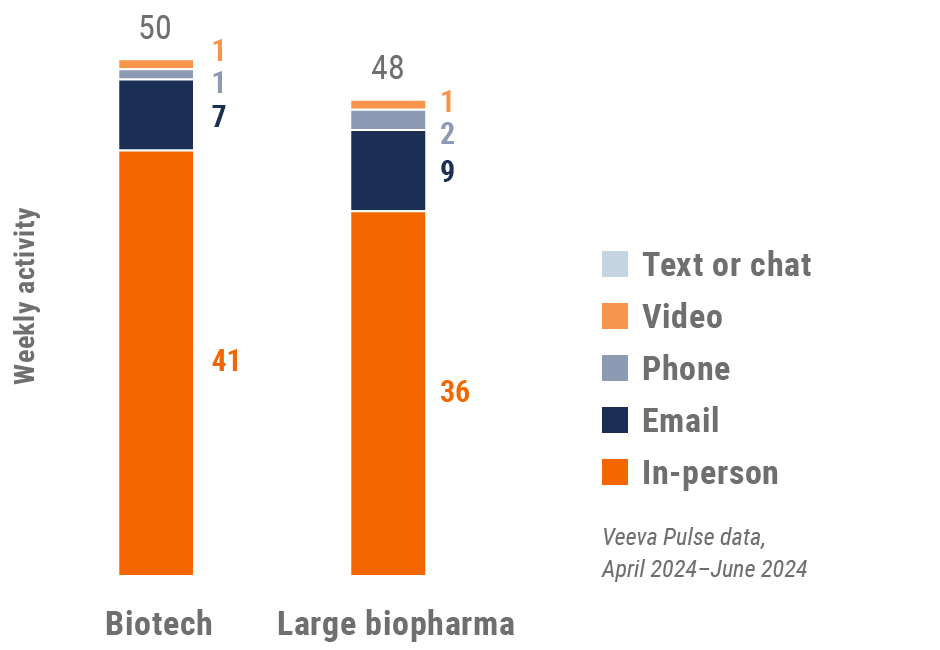
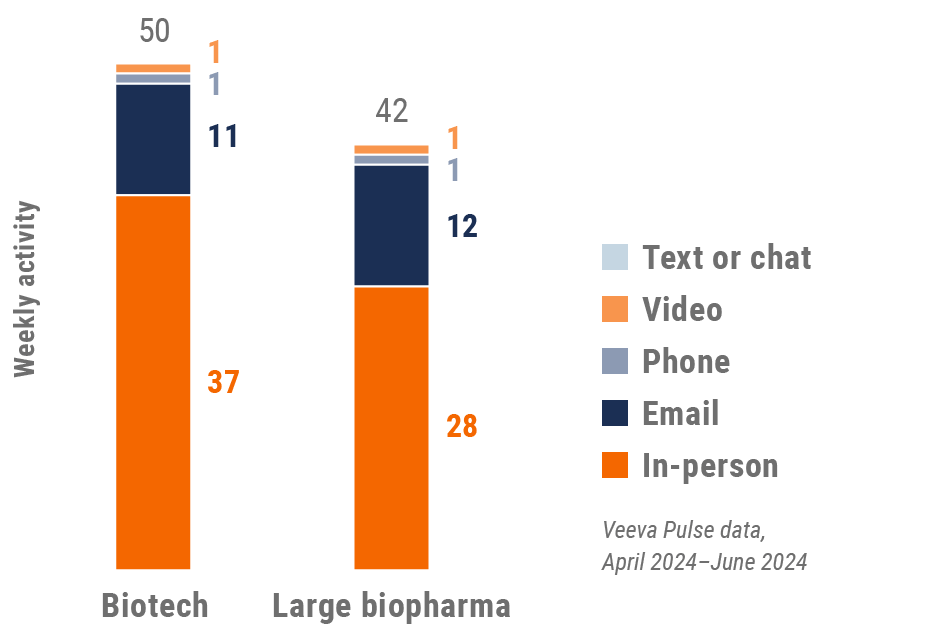
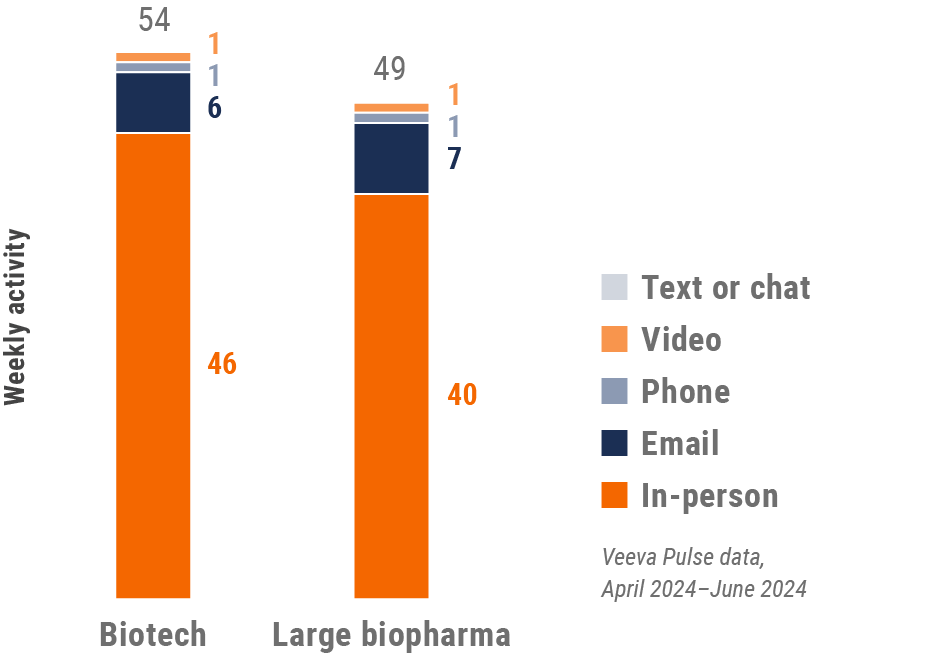
Figure 5: Activity by company size, global
Global engagement quality
Consolidation of key quality metrics
Figure 6: Approved email volume, global
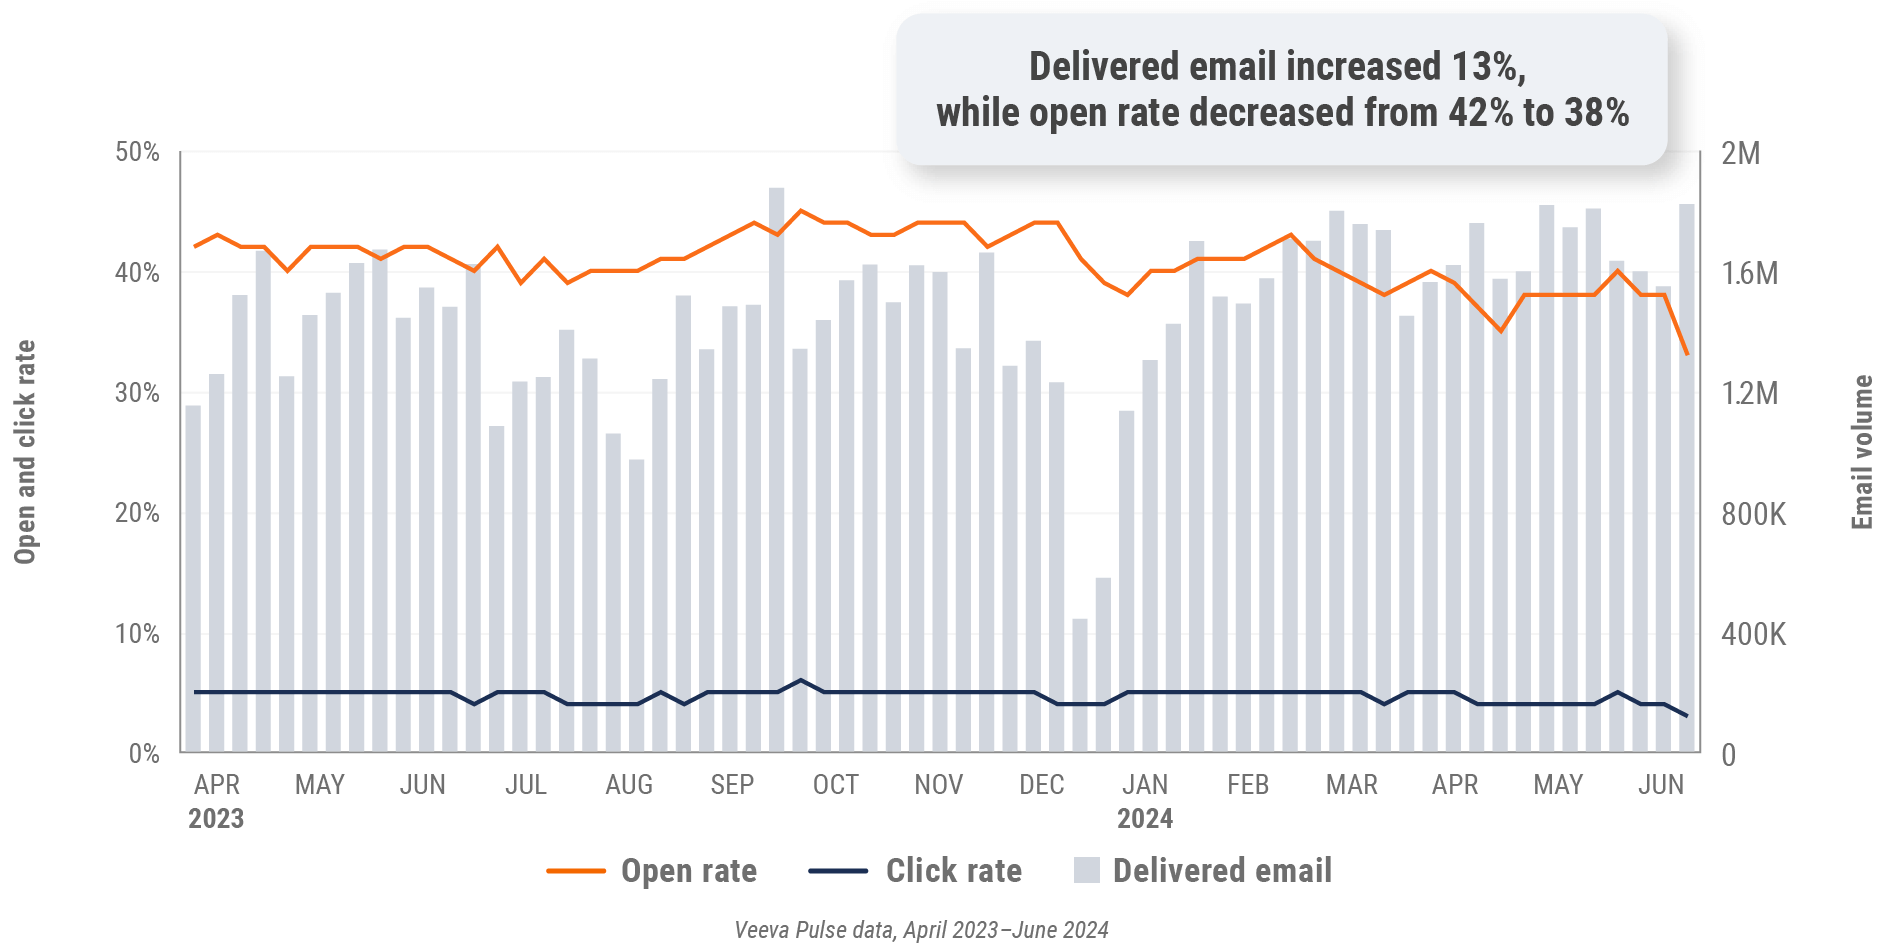
Figure 7: Content usage by channel, global
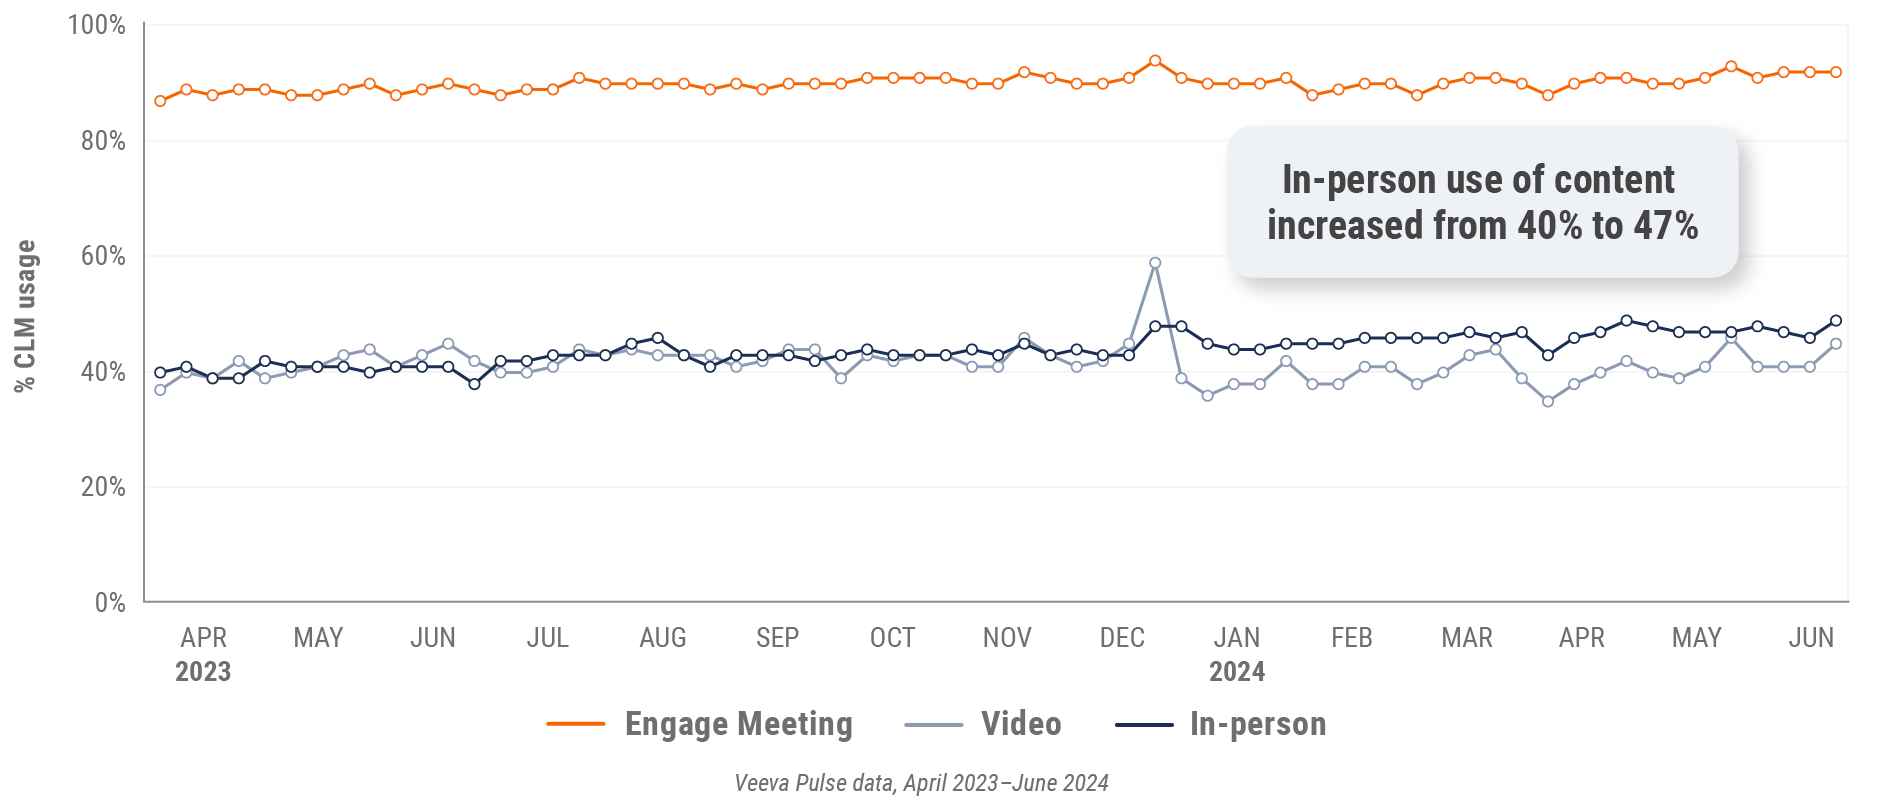
Figure 8: Veeva CRM Engage meeting duration, global

*This quarter’s global trends report omits data from China.
U.S. market trends
Figure 9: Channel mix evolution, U.S.
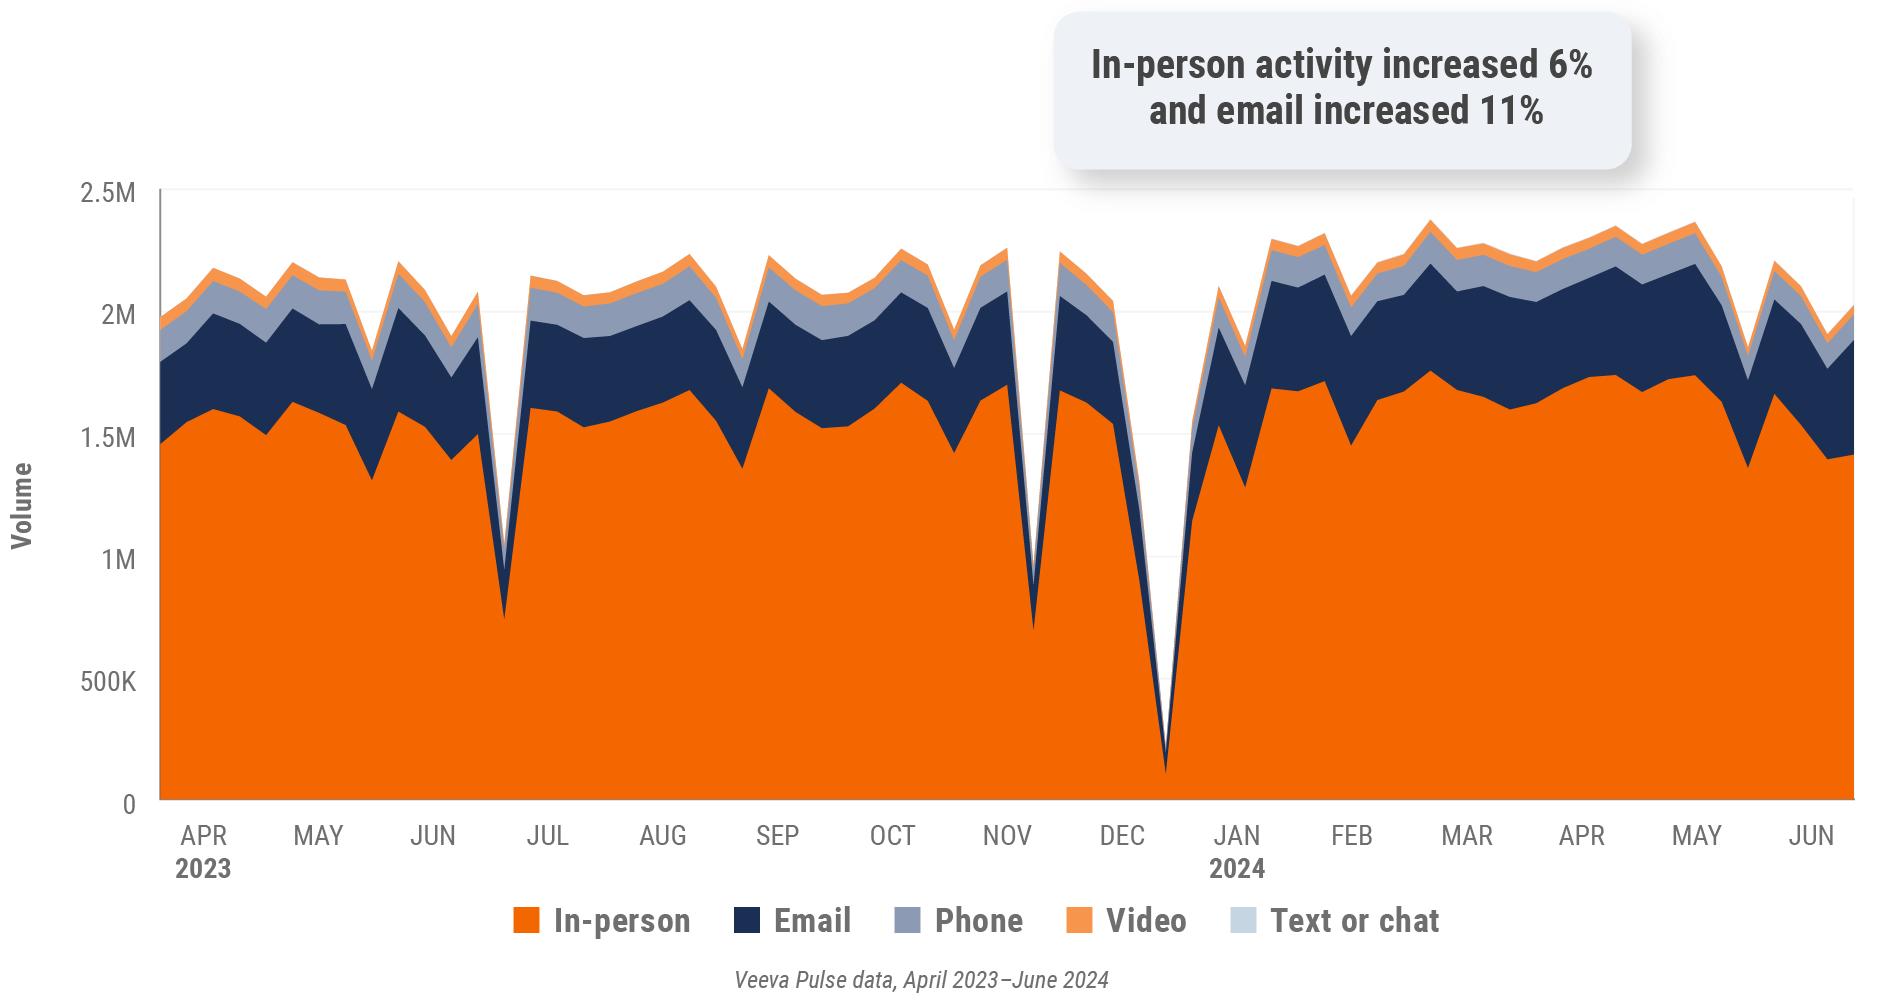
Figure 10: Channel mix, U.S.
U.S. field team activity
Weekly activity per user by engagement channel
Figure 11: Activity, U.S.
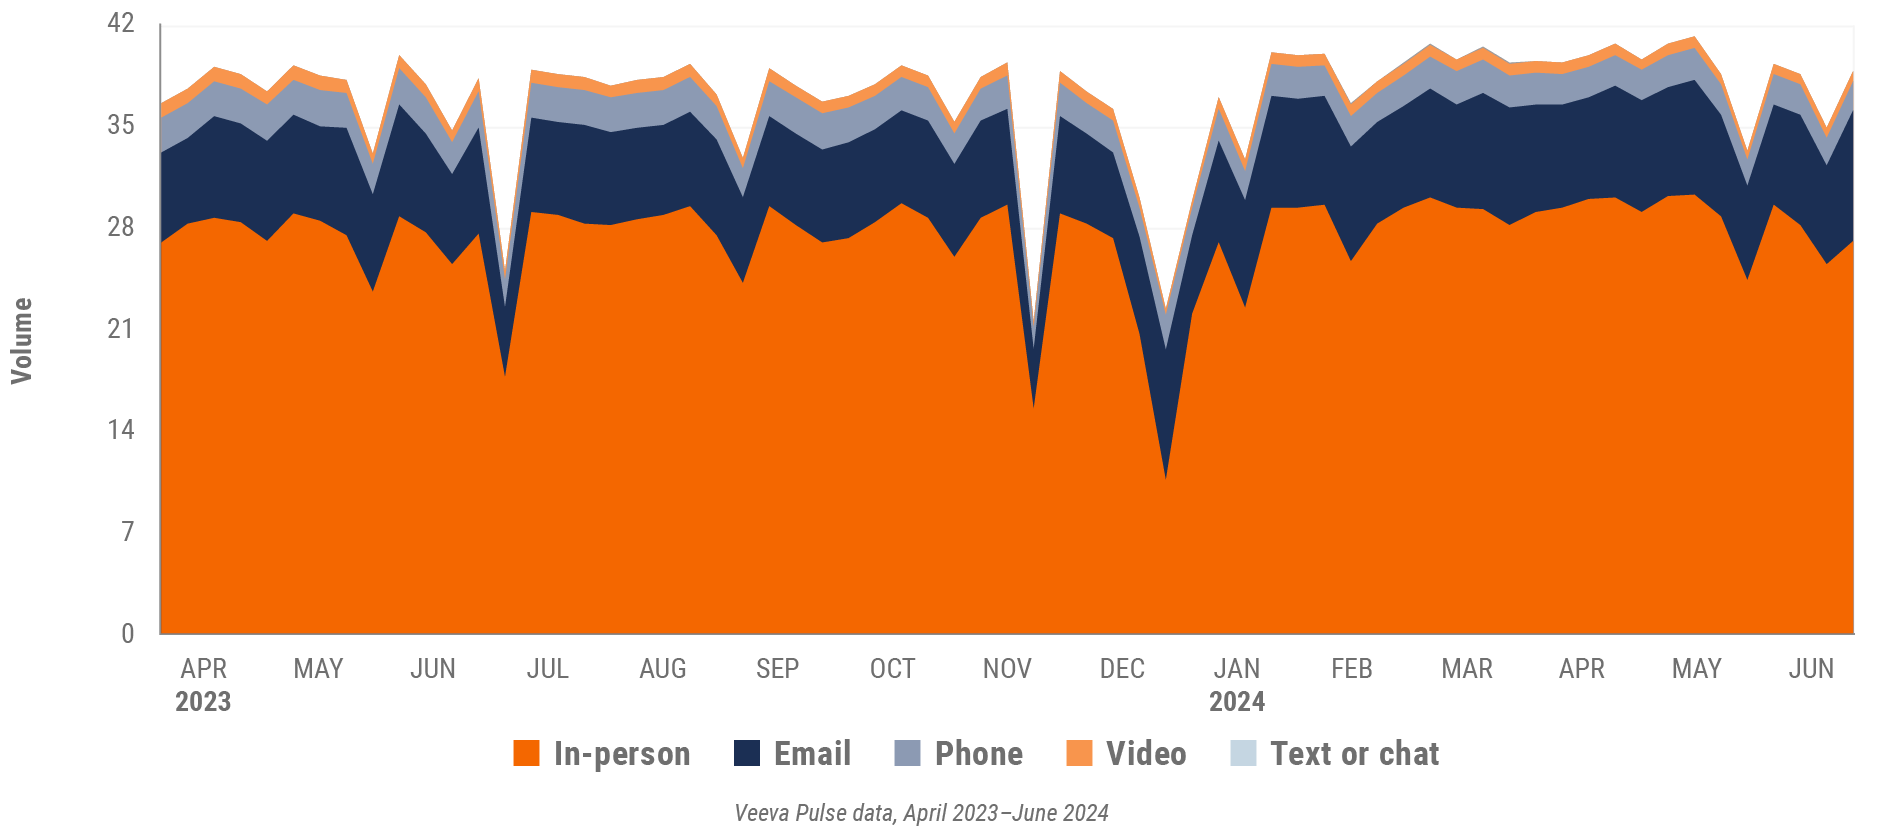
Figure 12: Activity by user type, U.S.
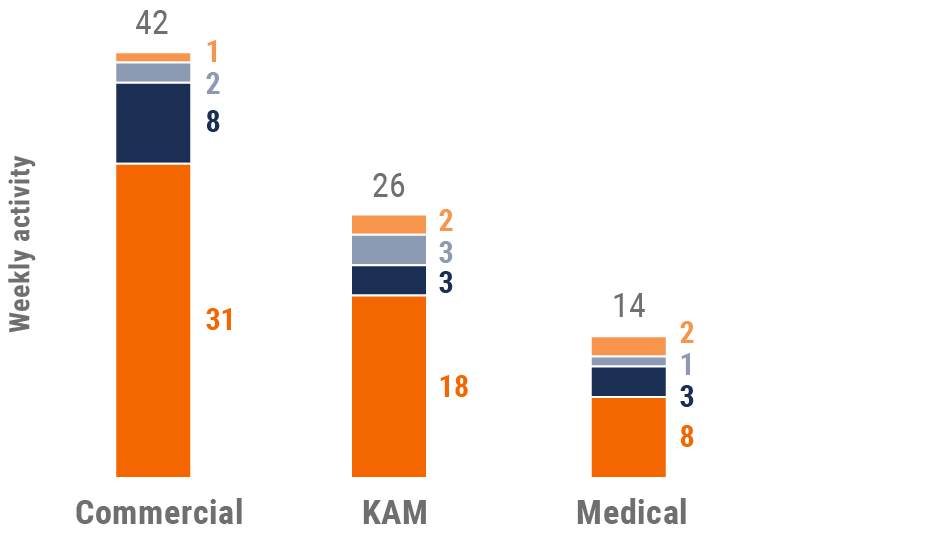
Figure 13: Activity by company size, U.S.
U.S. engagement quality
Consolidation of key quality metrics
Figure 14: Approved email volume, U.S.
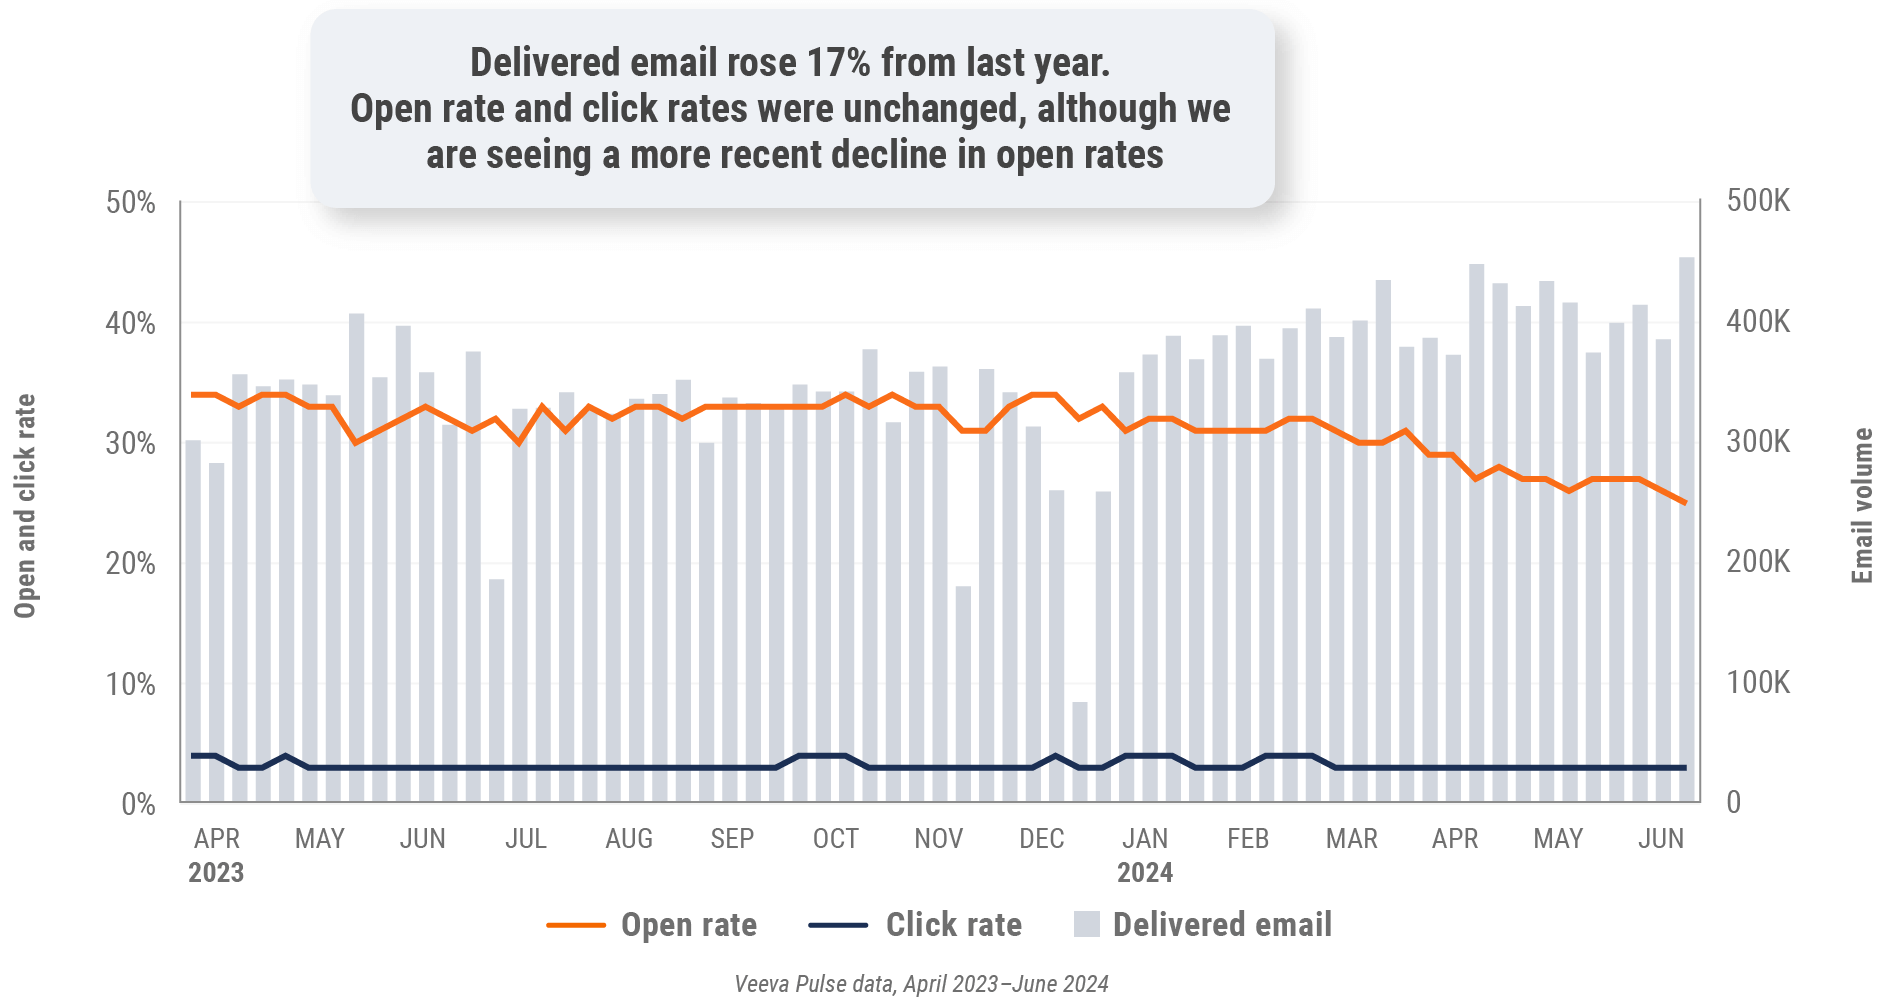
Figure 15: Content usage by channel, U.S.
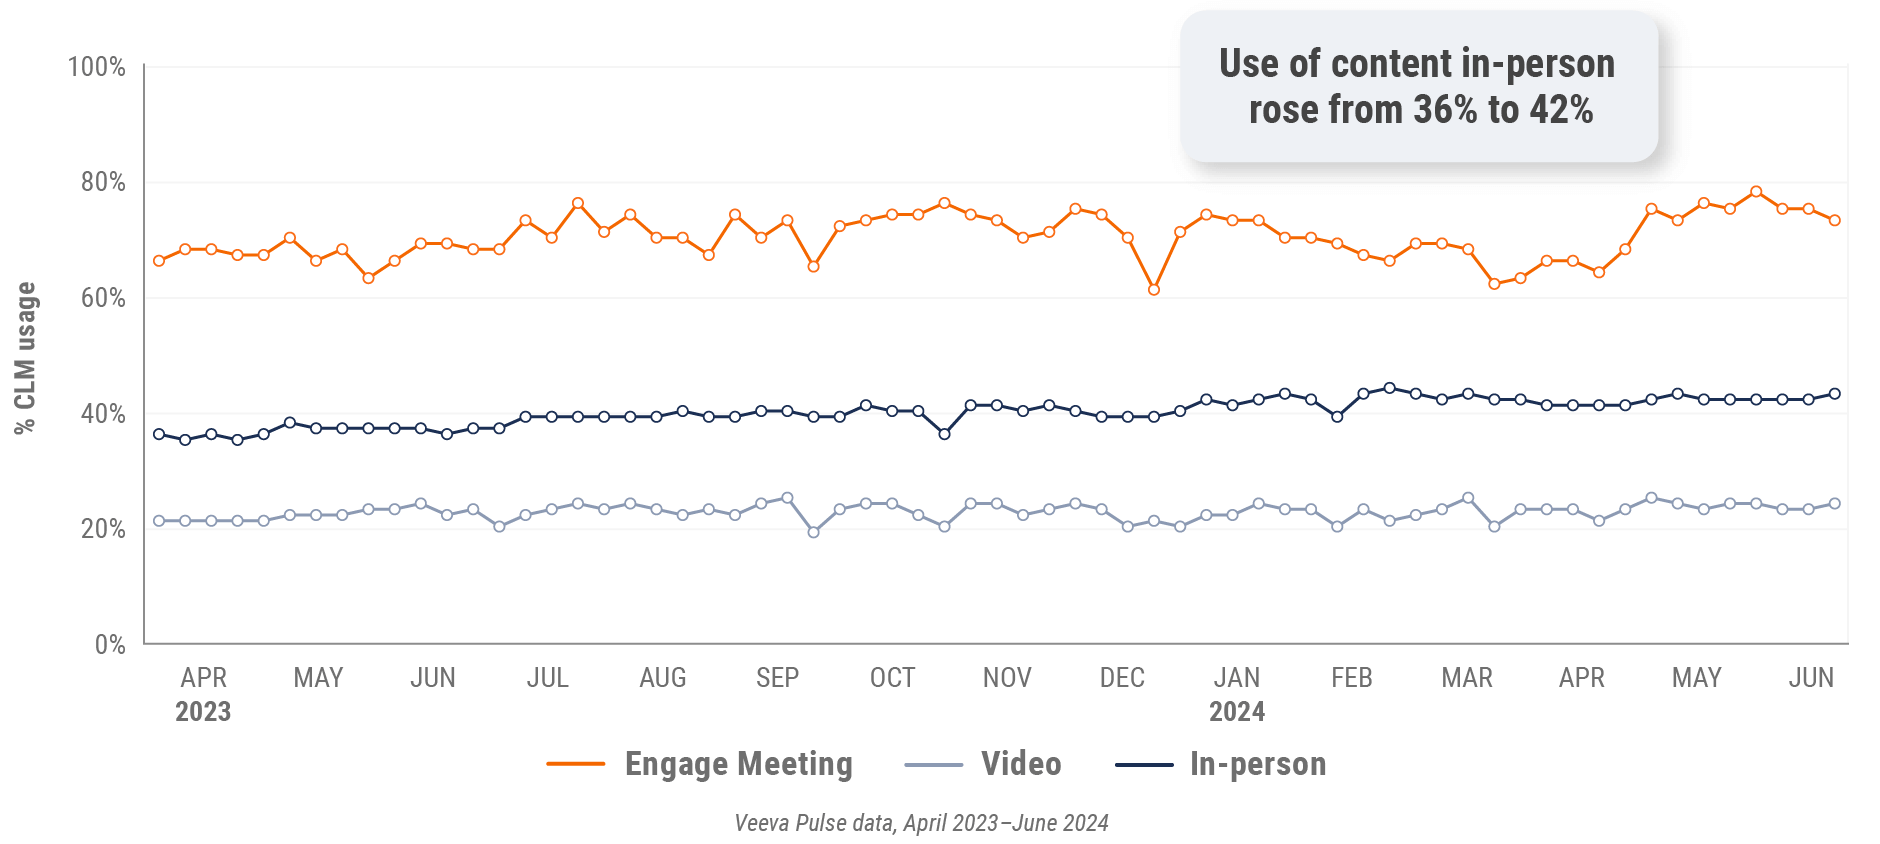
Figure 16: Veeva CRM Engage meeting duration, U.S.

Europe market trends
Figure 17: Channel mix evolution, Europe
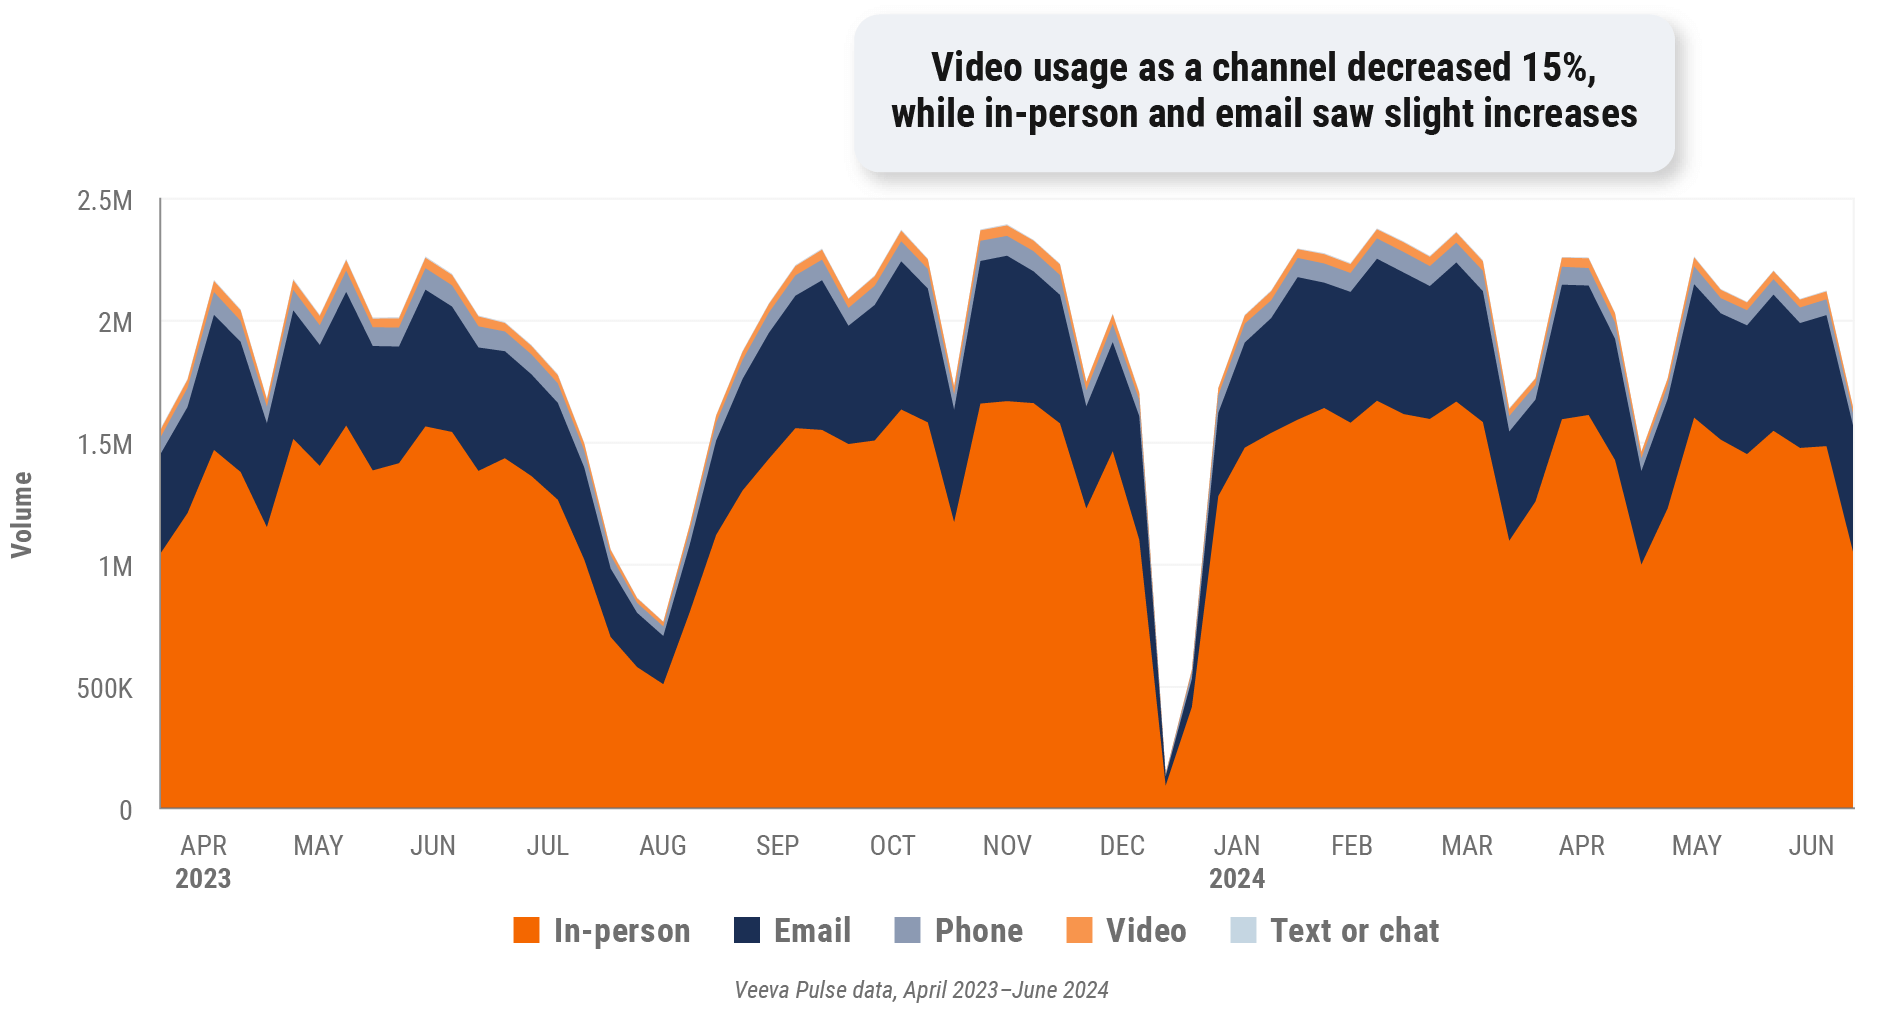
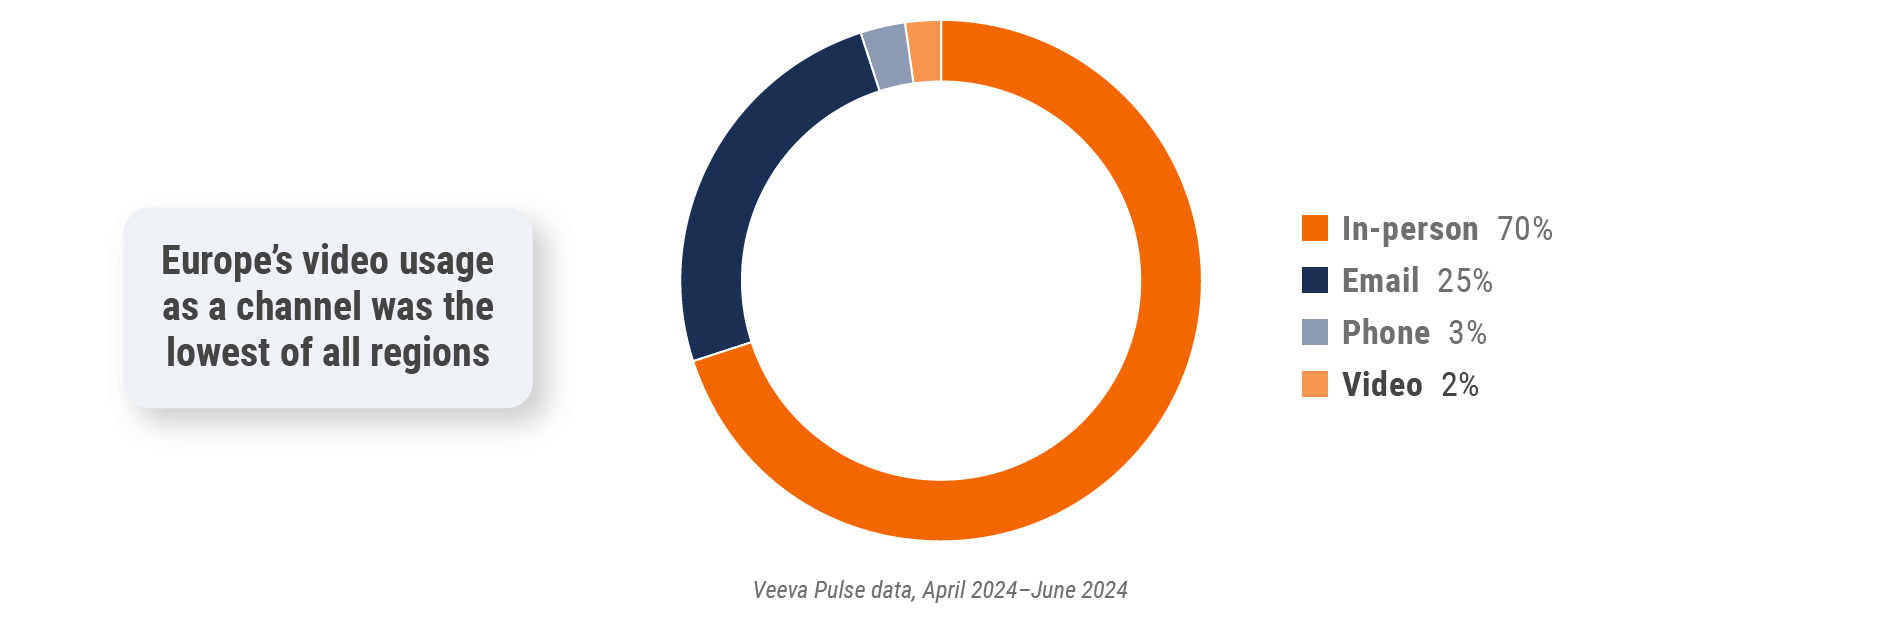
Figure 18: Channel mix, Europe
Europe field team activity
Weekly activity per user by engagement channel
Figure 19: Activity by country, EU5
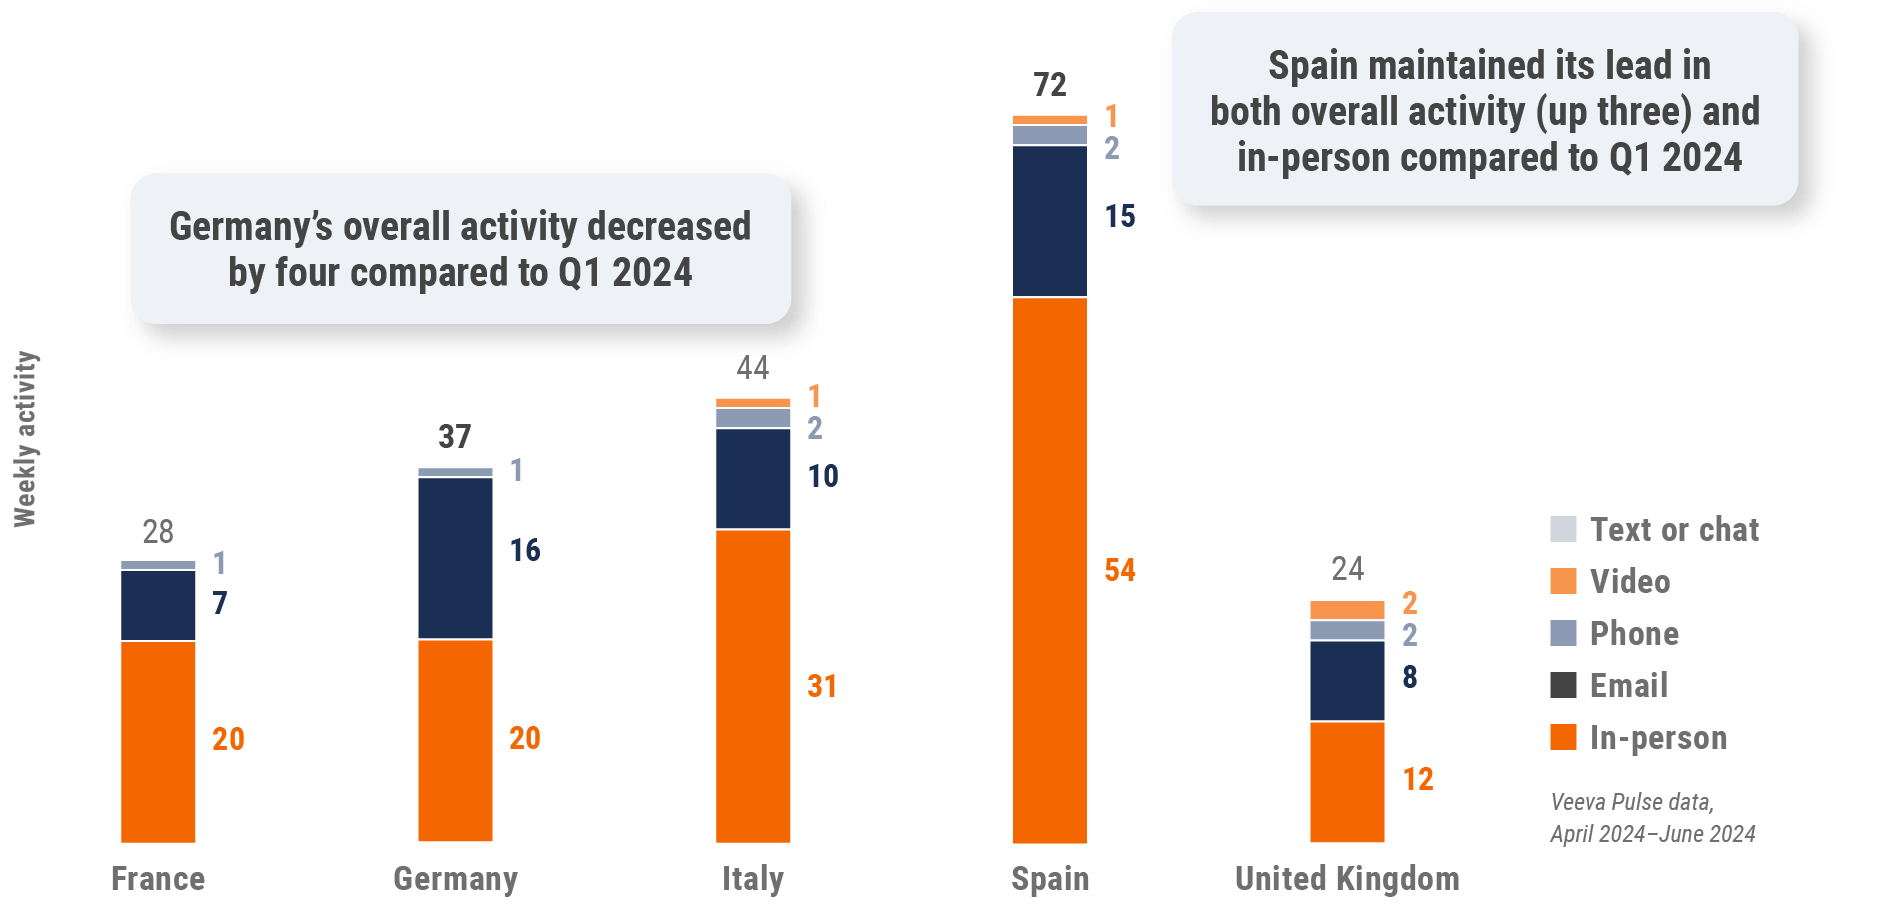
Figure 20: Activity by user type, Europe
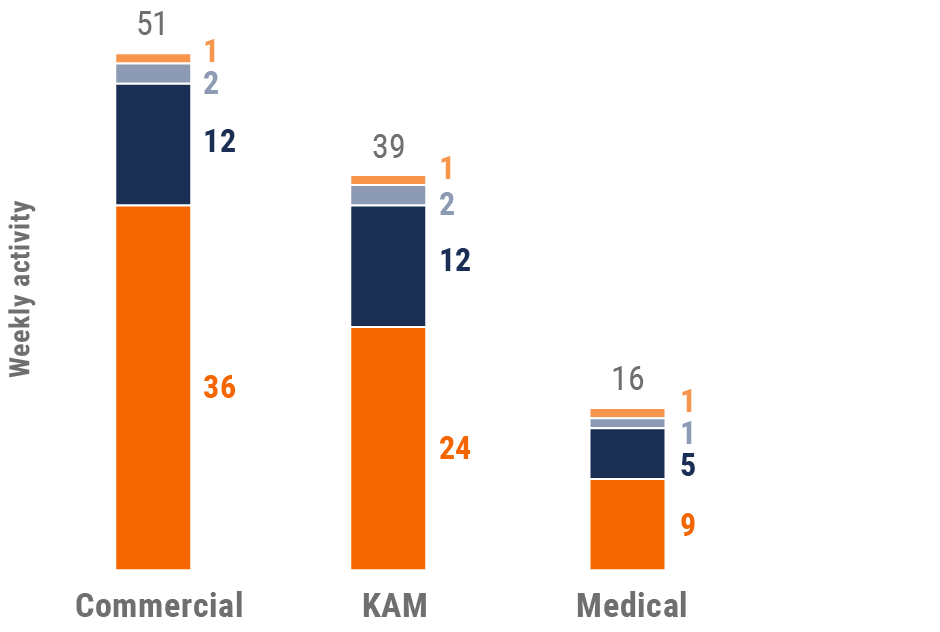
Figure 21: Activity by company size, Europe
Europe engagement quality
Consolidation of key quality metrics
Figure 22: Approved email volume, Europe
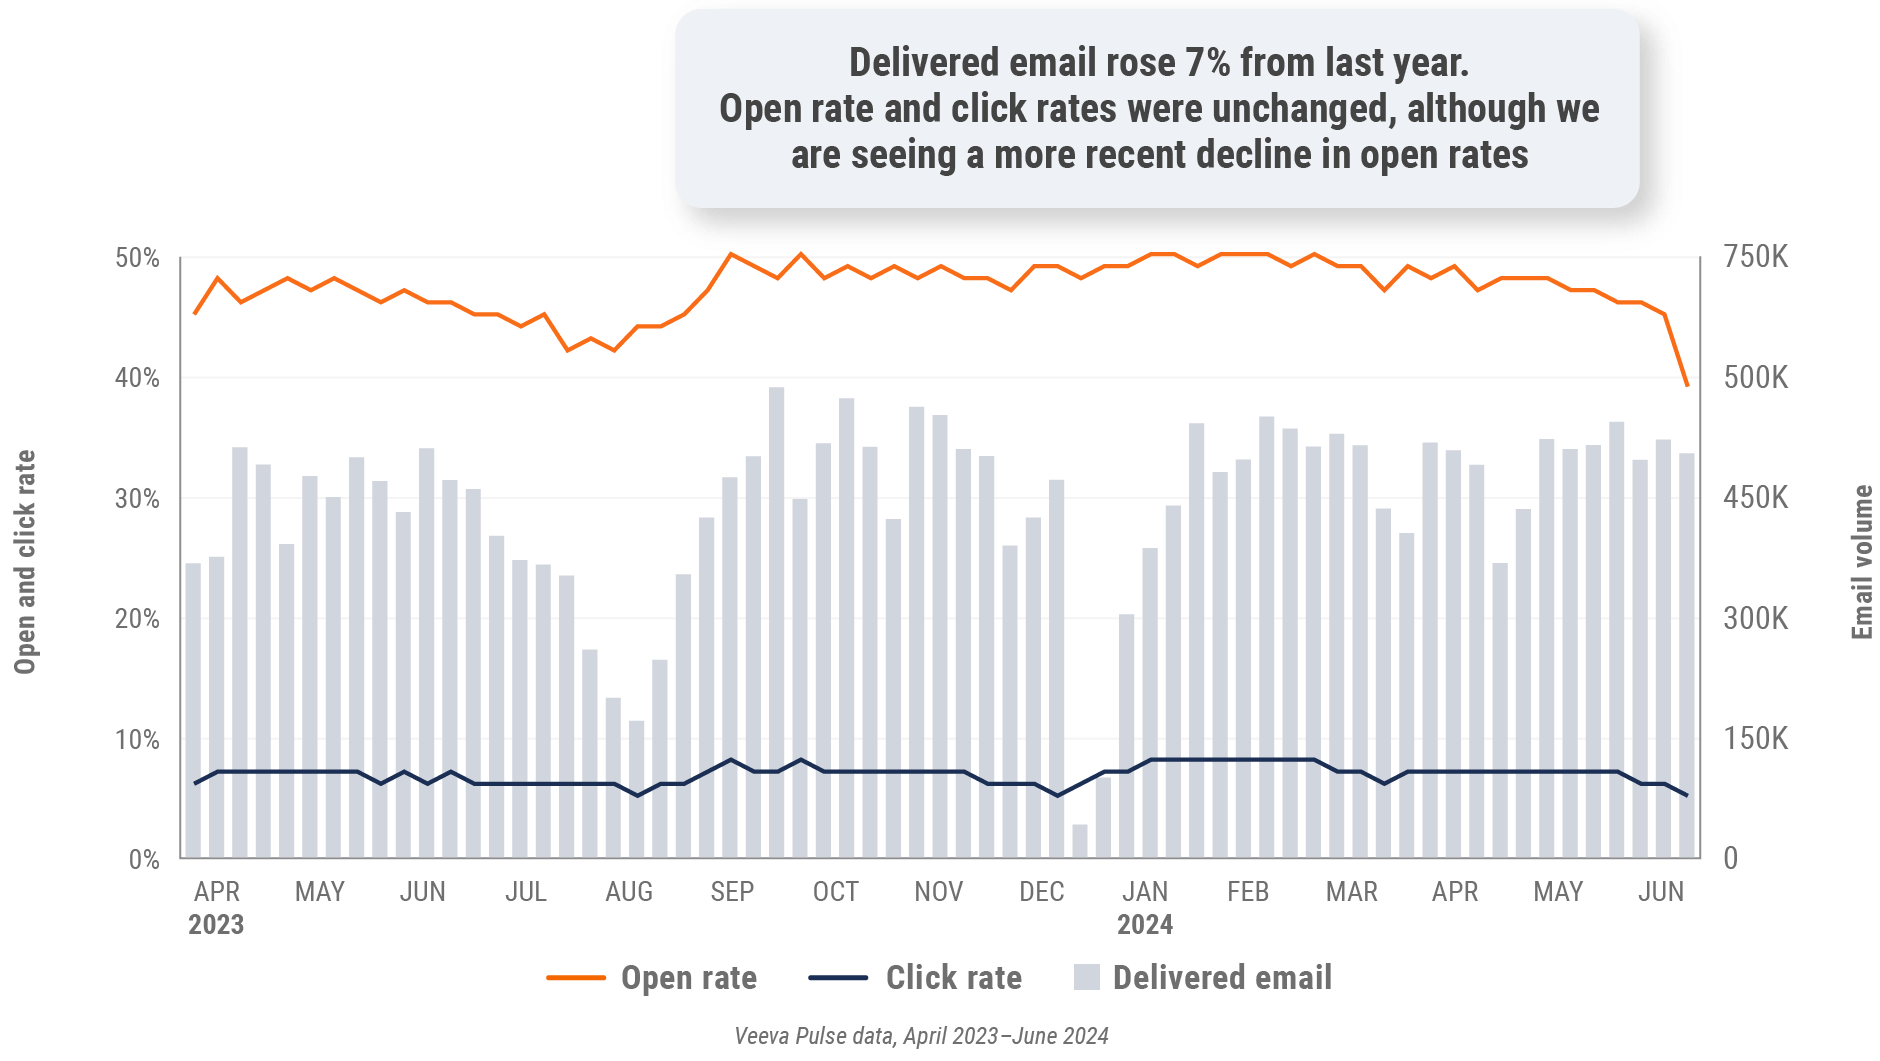
Figure 23: Content usage by channel, Europe
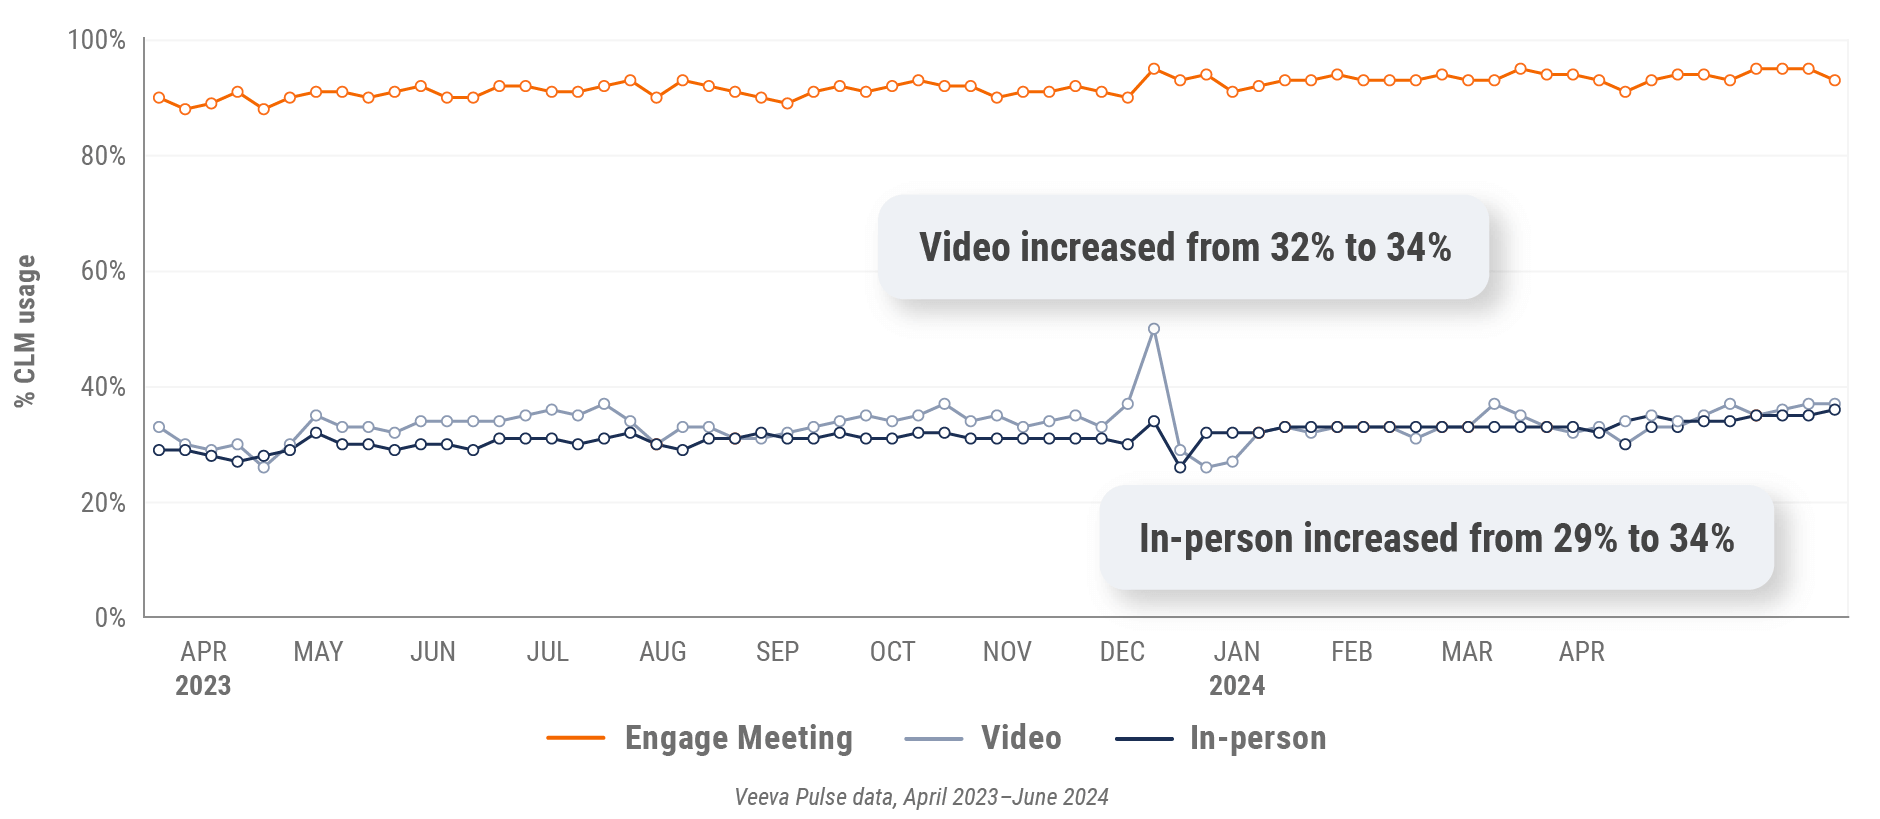
Figure 24: Veeva CRM Engage meeting duration, Europe

Asia market trends
Figure 25: Channel mix evolution, Asia
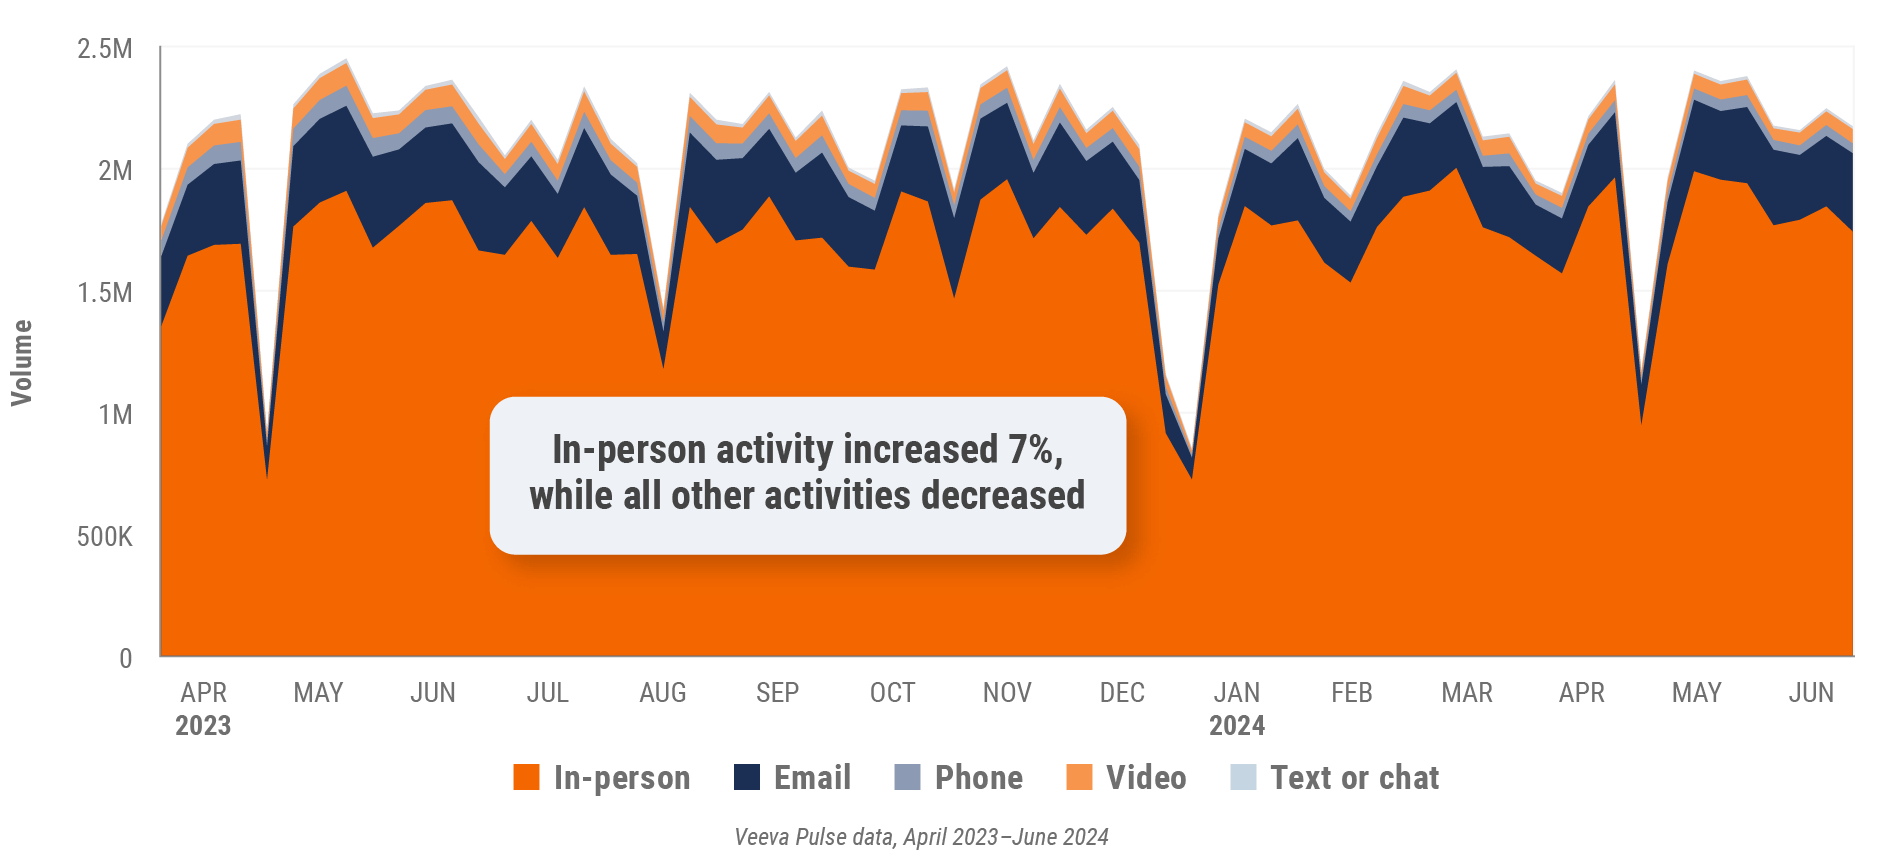
Figure 26: Channel mix, Asia
Asia field team activity
Weekly activity per user by engagement channel
Figure 27: Activity by country, Asia
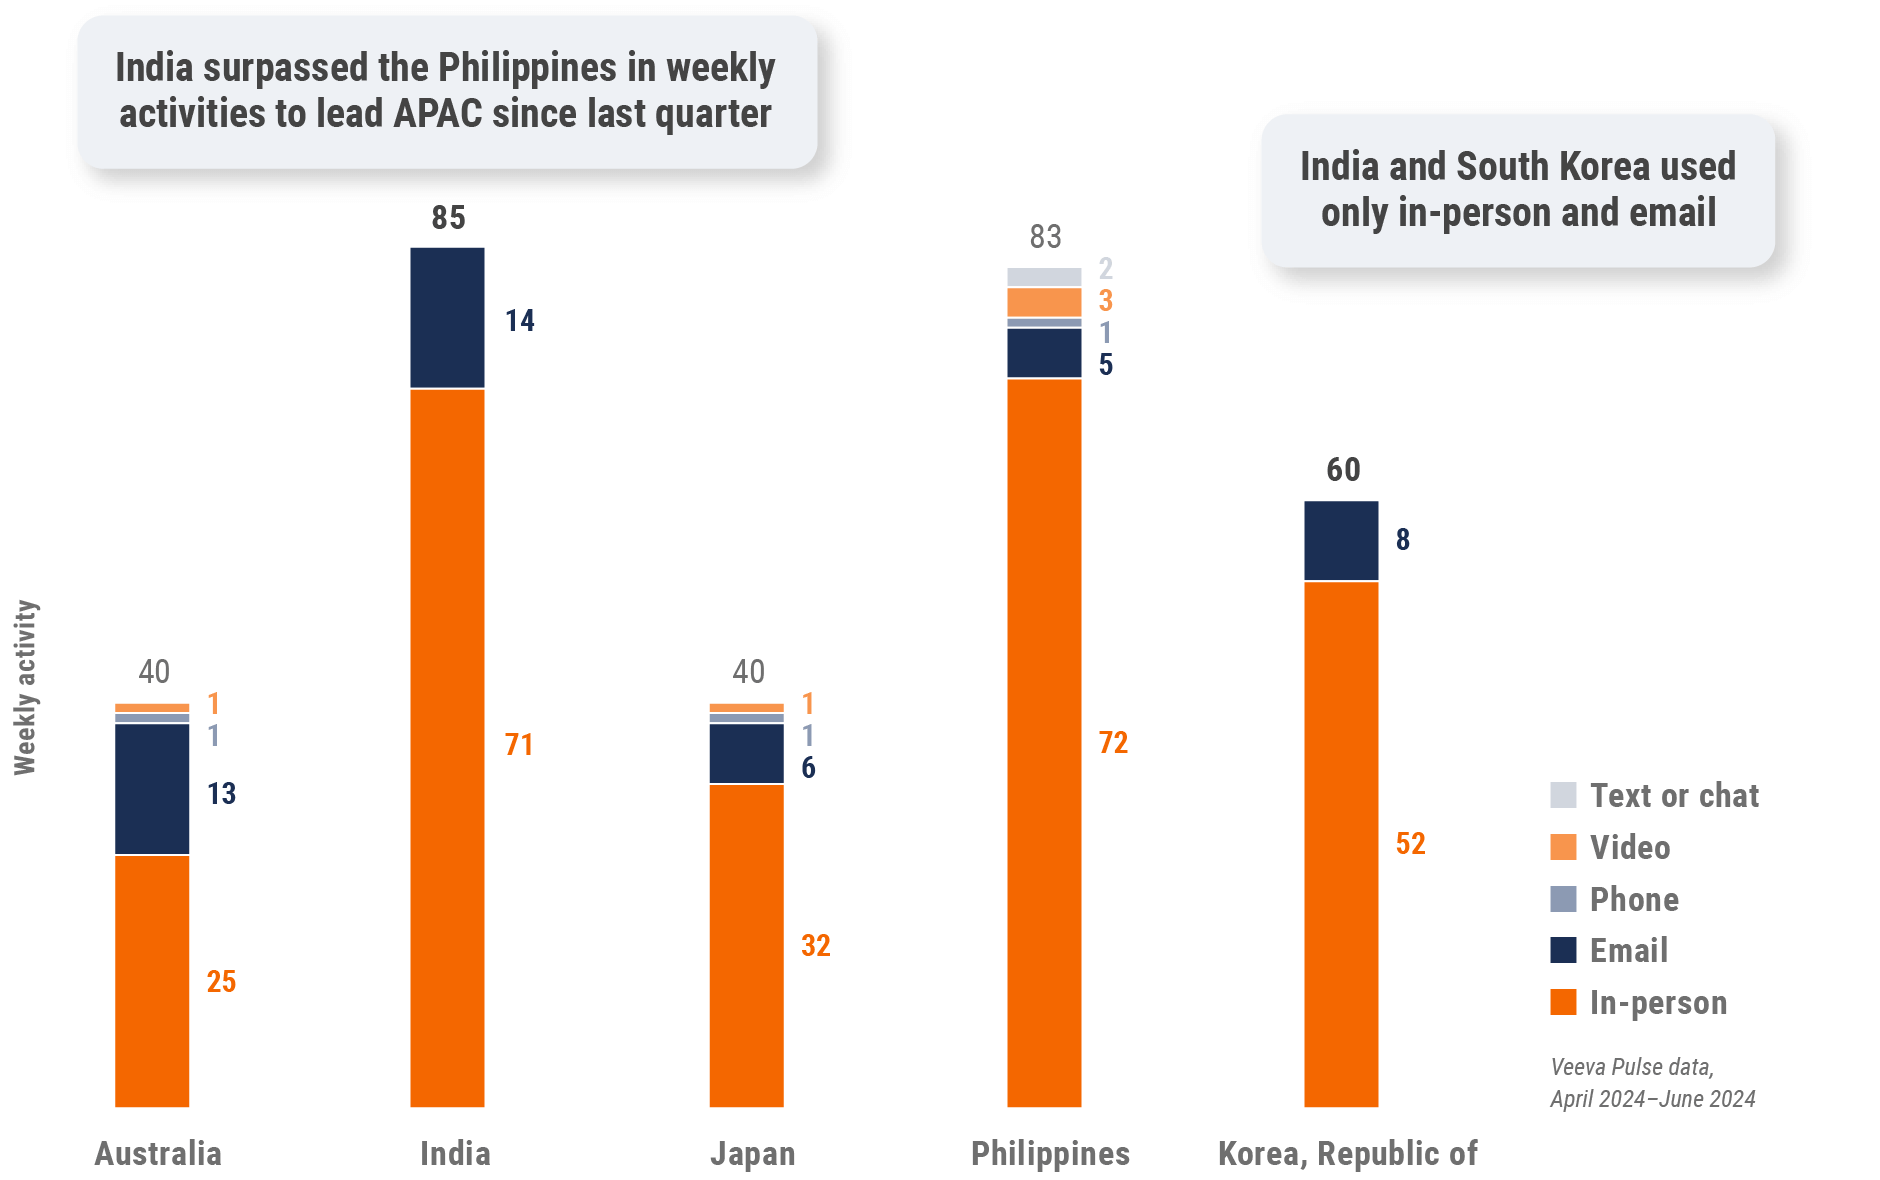
Figure 28: Activity by user type, Asia
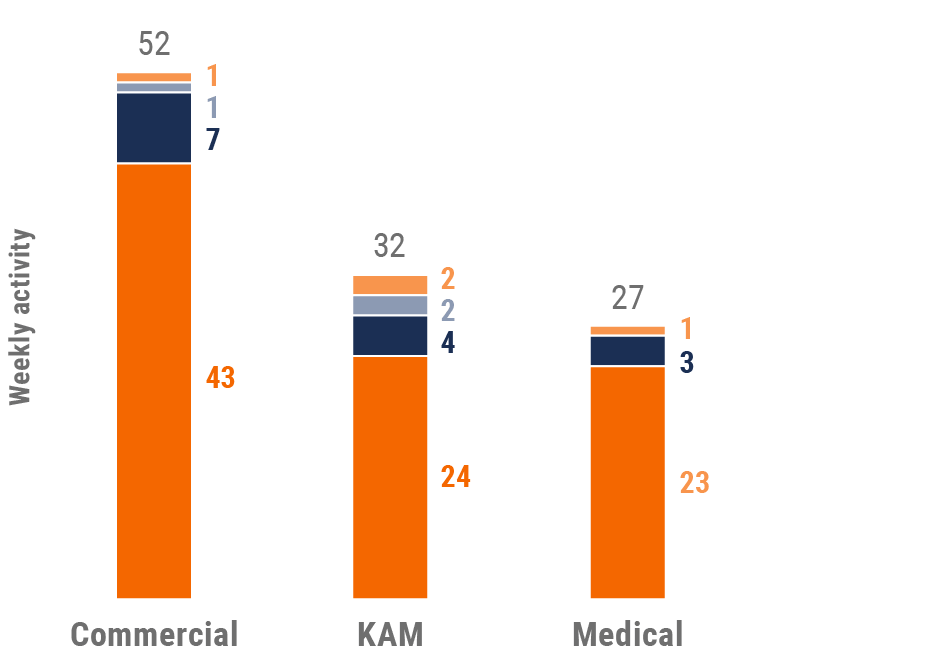
Figure 29: Activity by company size, Asia
Asia engagement quality
Consolidation of key quality metrics
Figure 30: Approved email volume, Asia
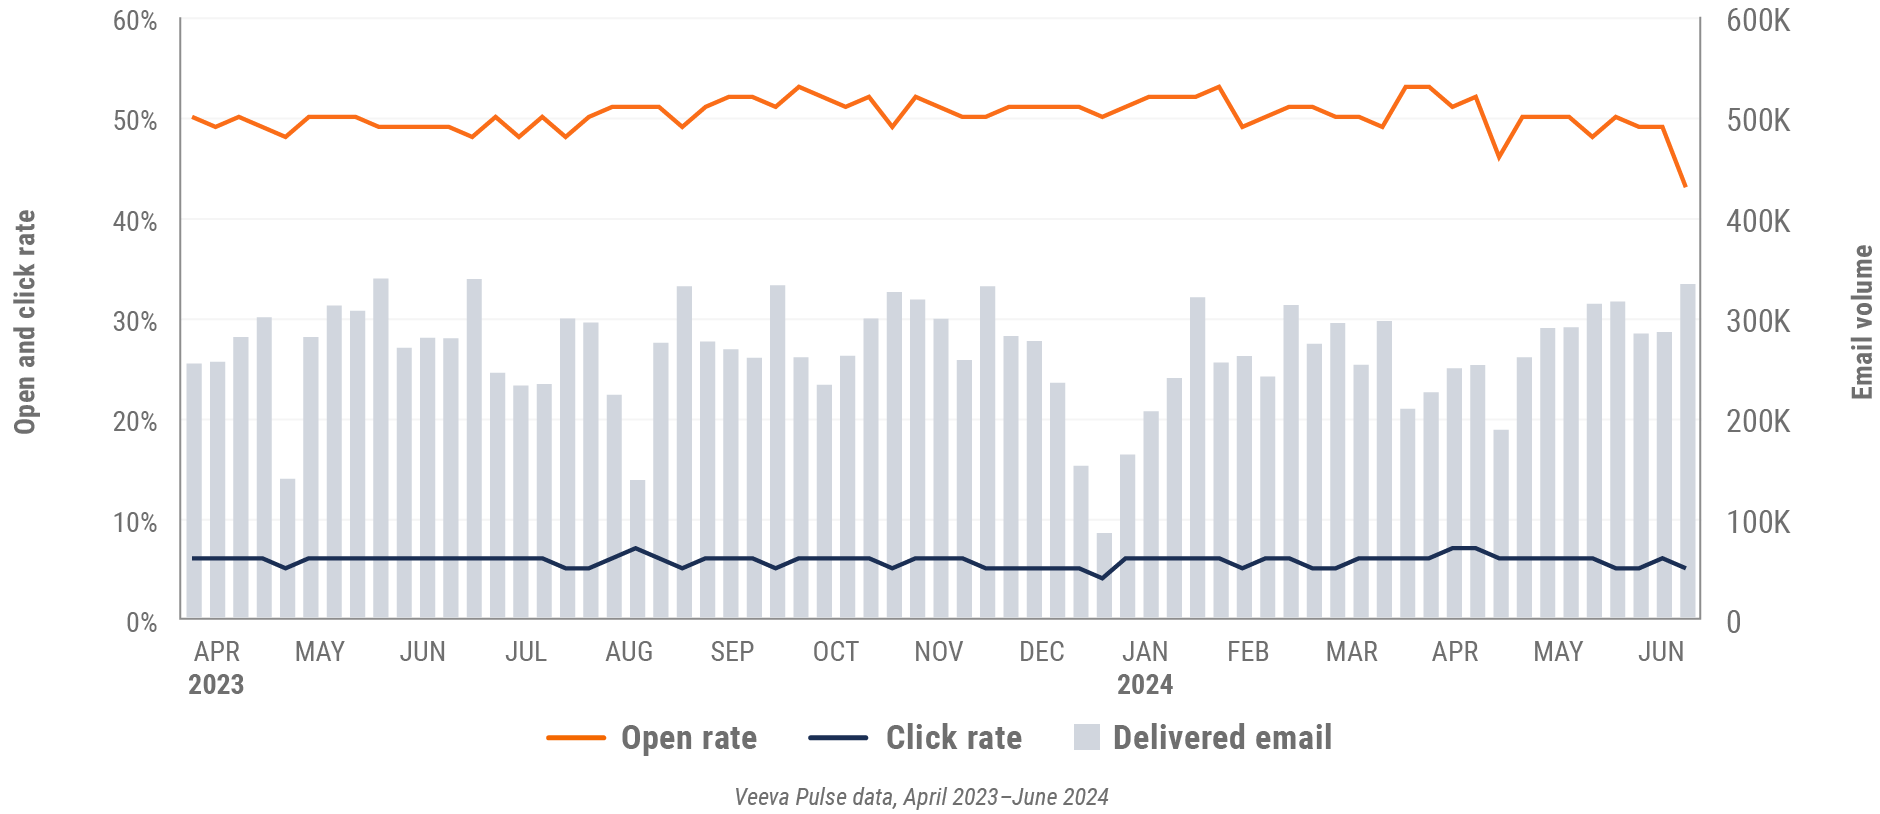
Figure 31: Content usage by channel, Asia
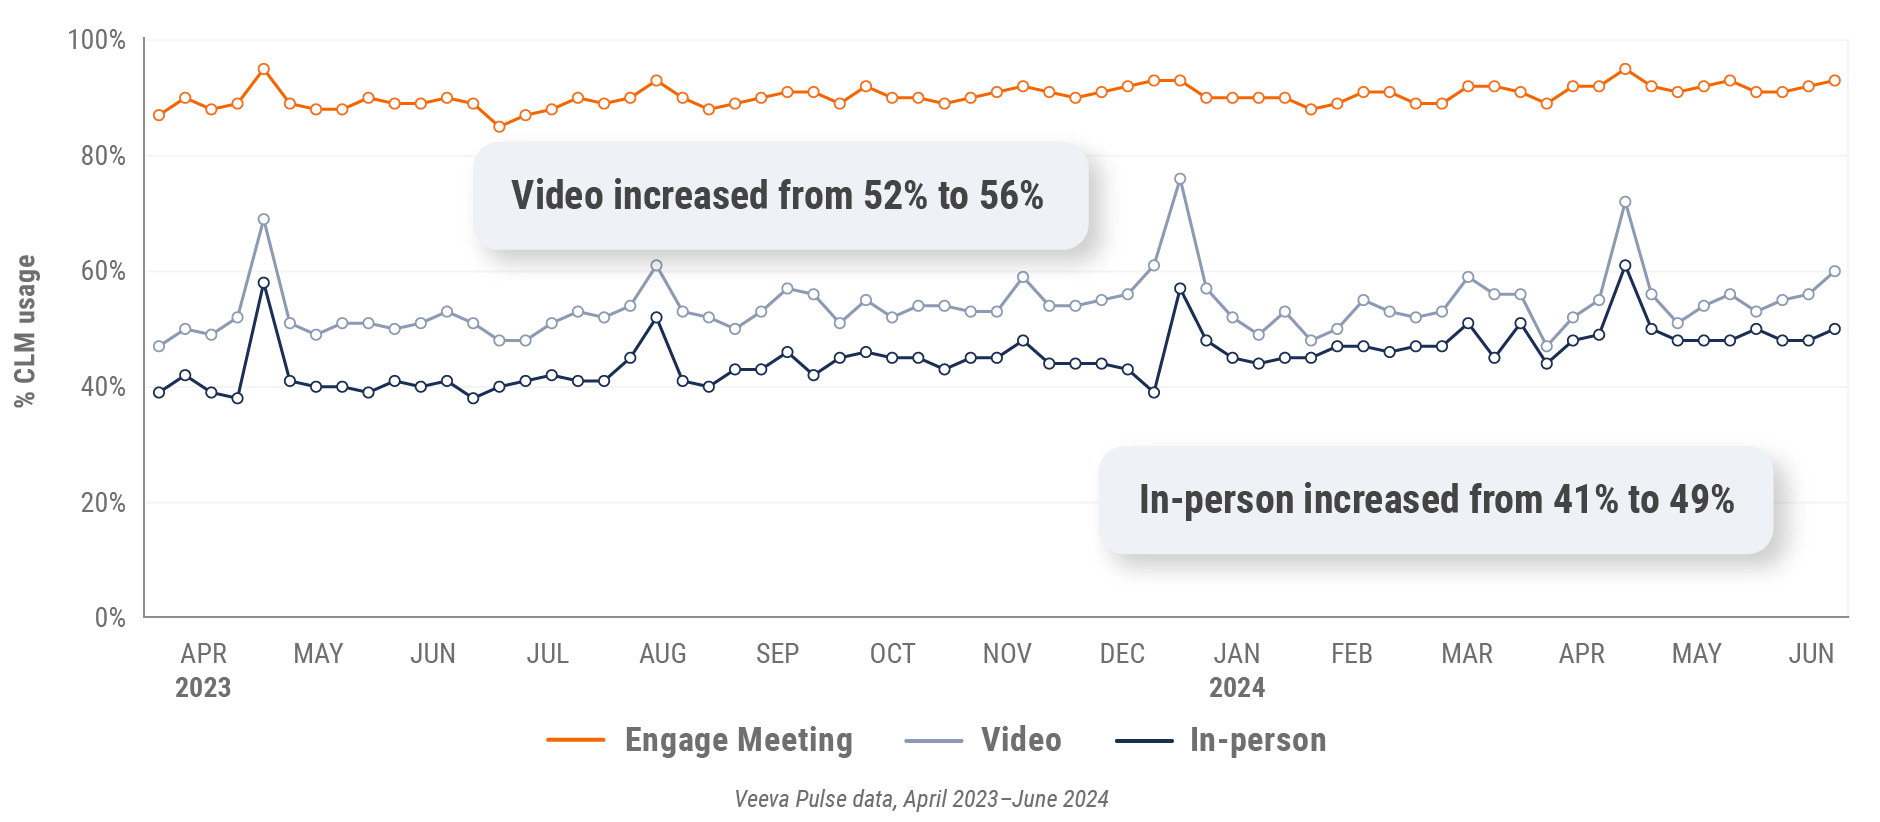
Figure 32: Veeva CRM Engage meeting duration, Asia

Latin America market trends*
Figure 33: Channel mix evolution, Latin America
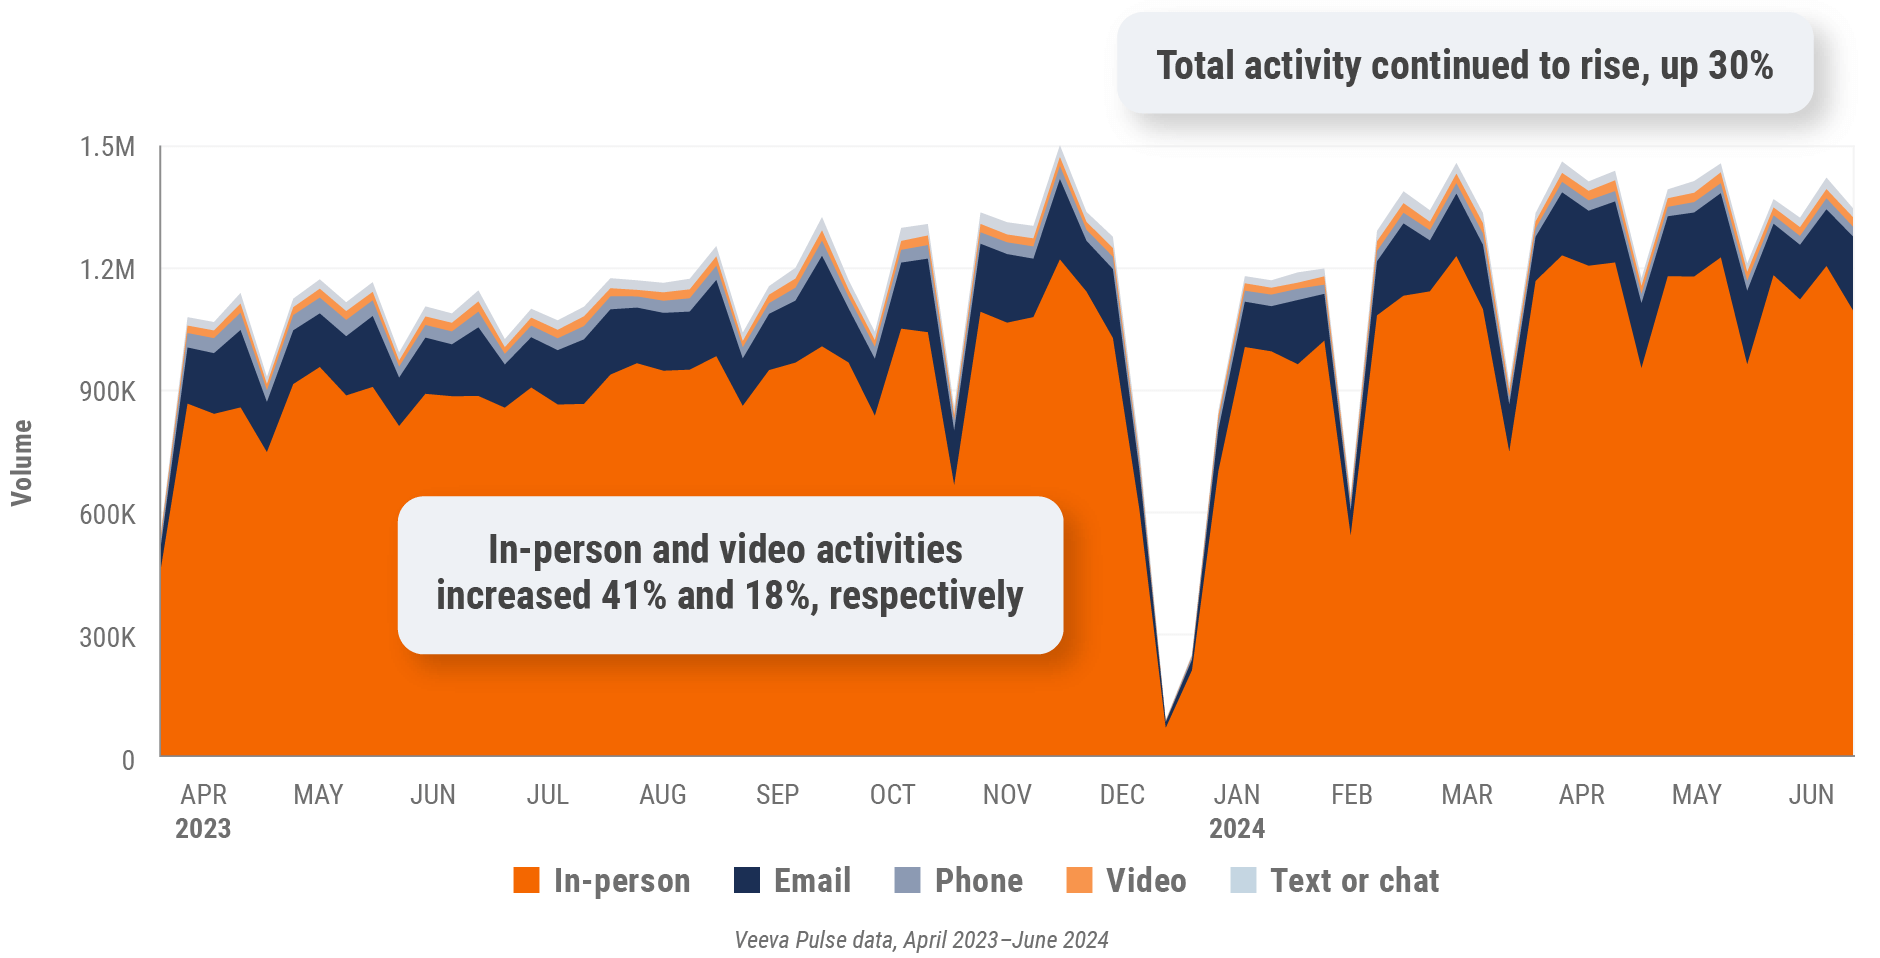
Figure 34: Channel mix, Latin America
Latin America field team activity
Weekly activity per user by engagement channel
Figure 35: Activity by country, Latin America
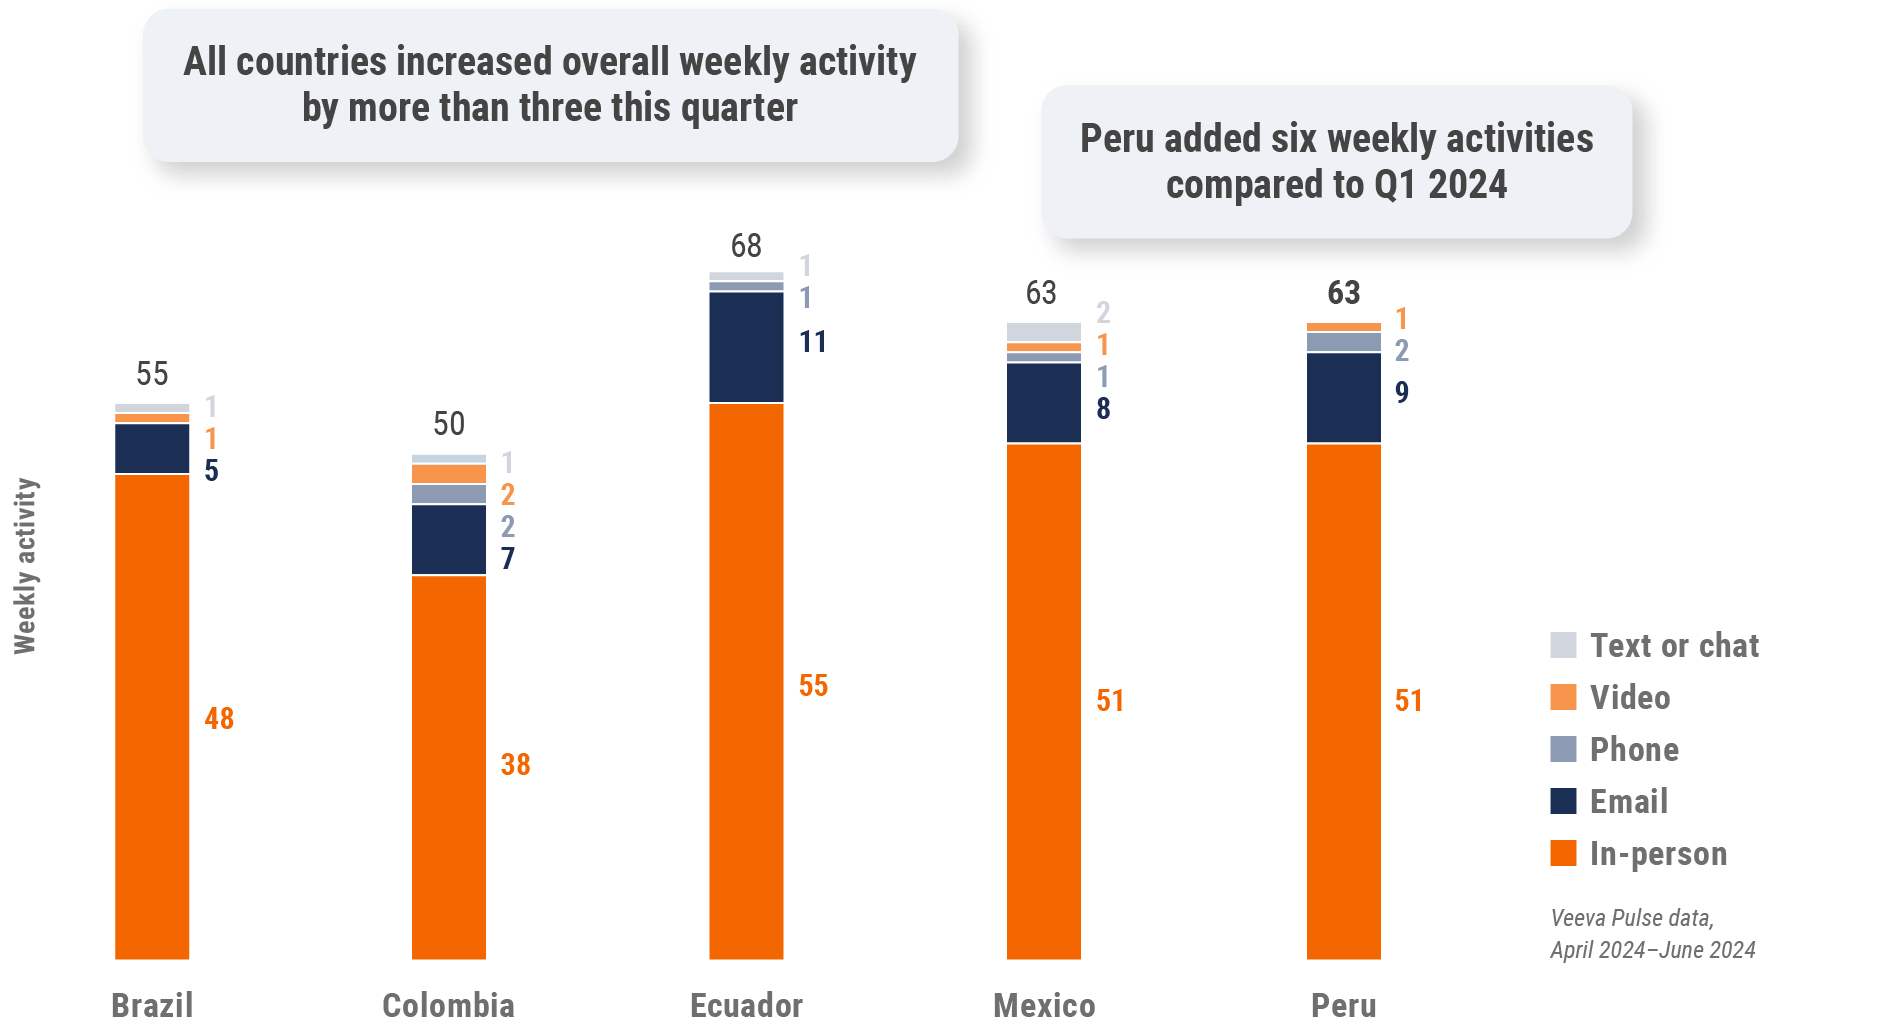
Figure 36: Activity by user type, Latin America
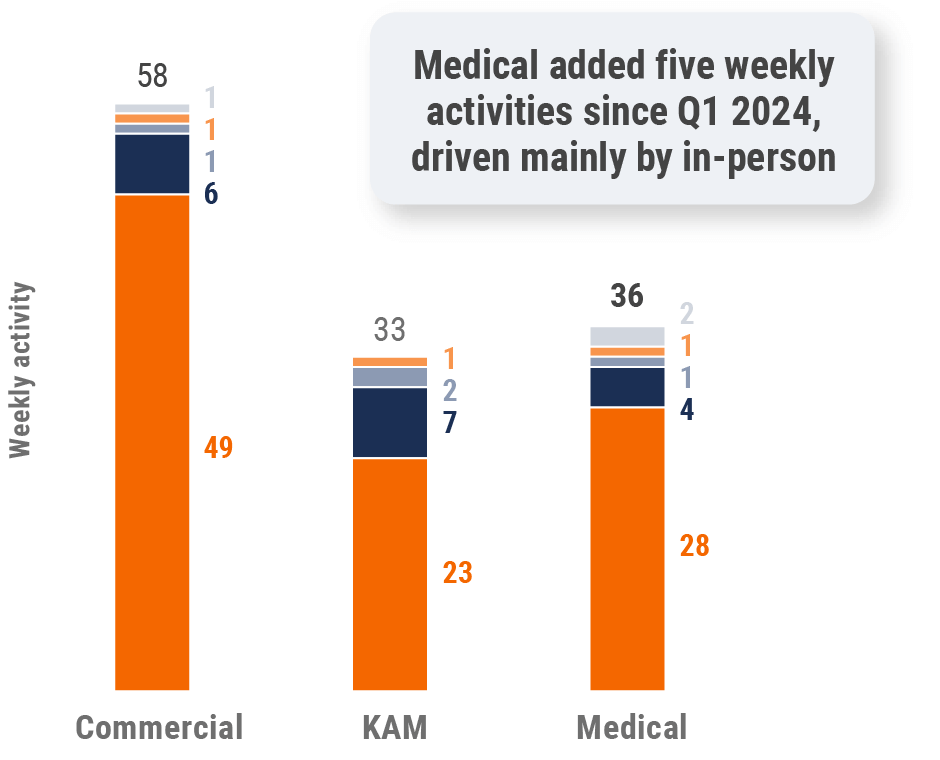
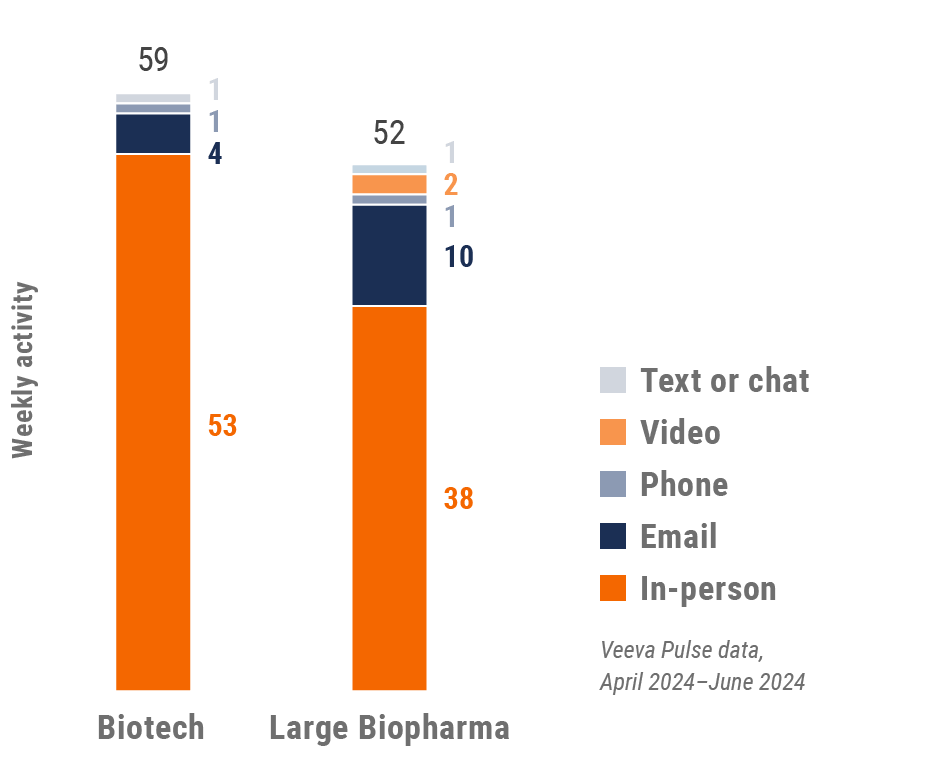
Figure 37: Activity by company size, Latin America
Latin America engagement quality
Consolidation of key quality metrics
Figure 38: Approved email volume, Latin America
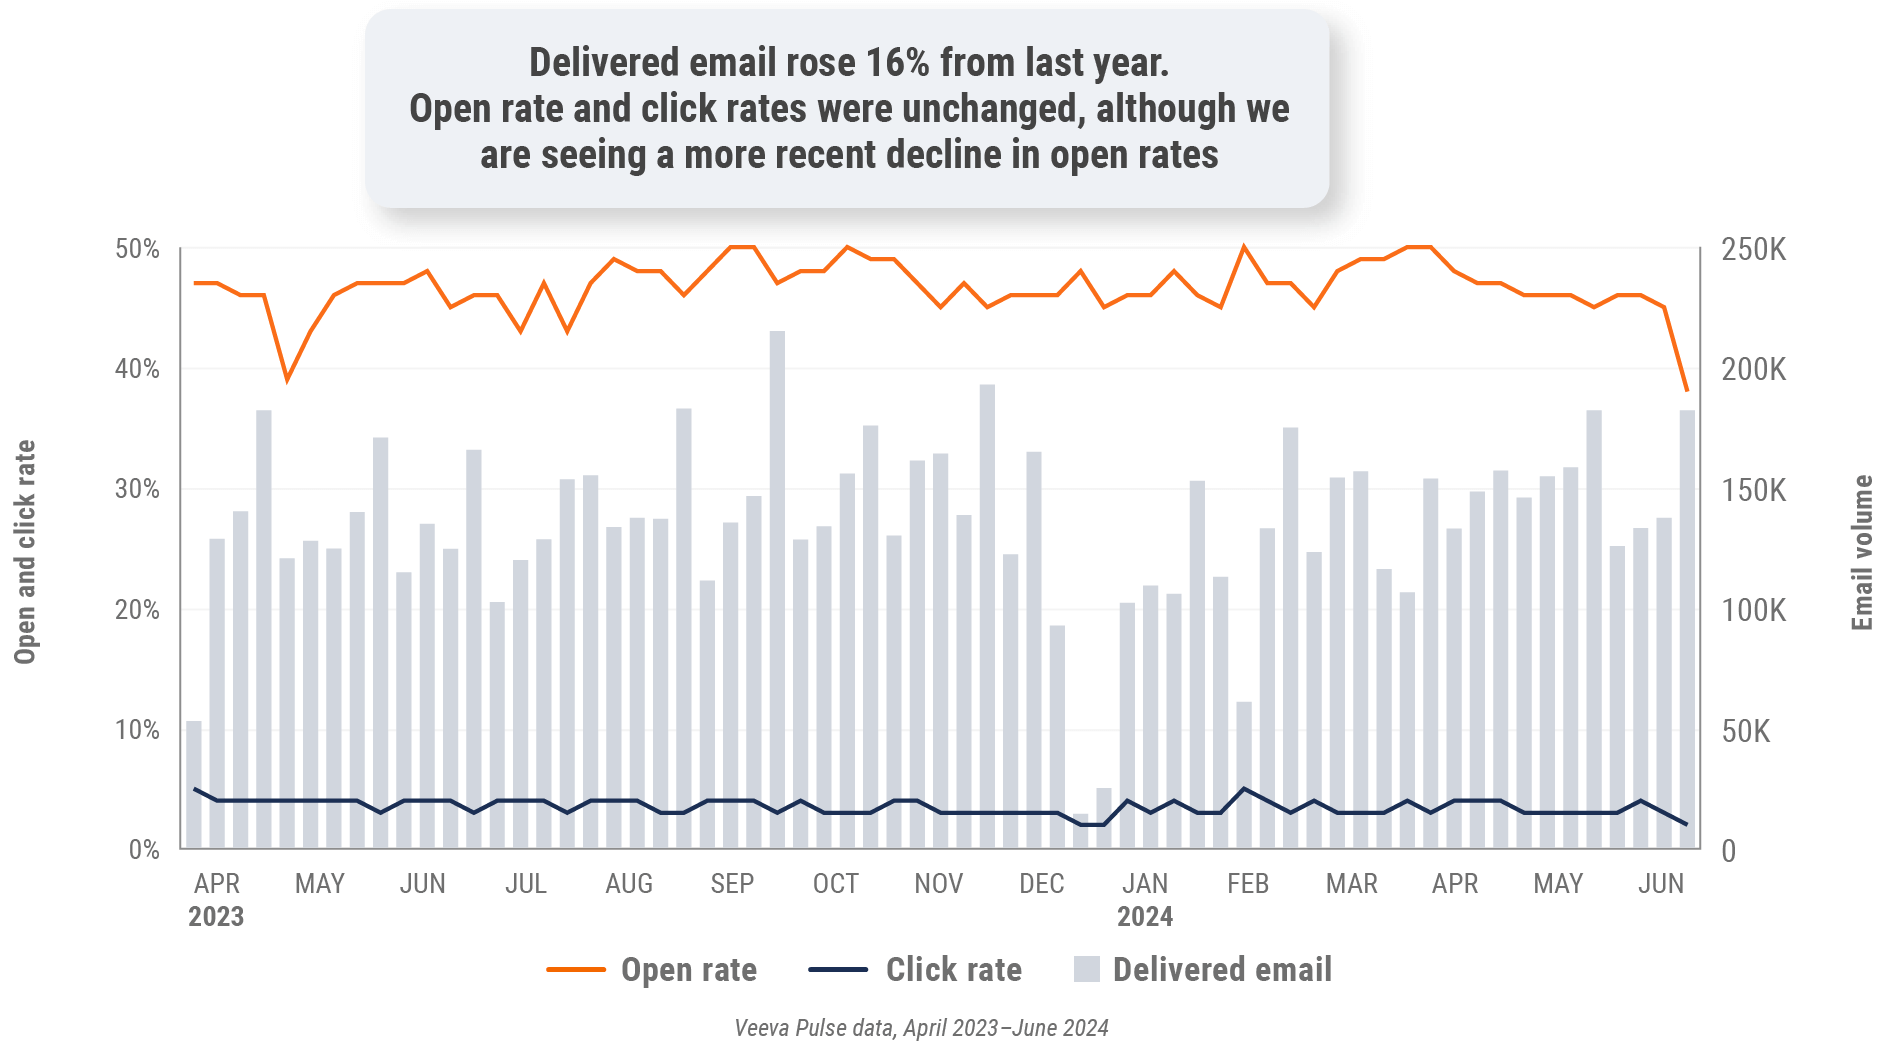
Figure 39: Content usage by channel, Latin America
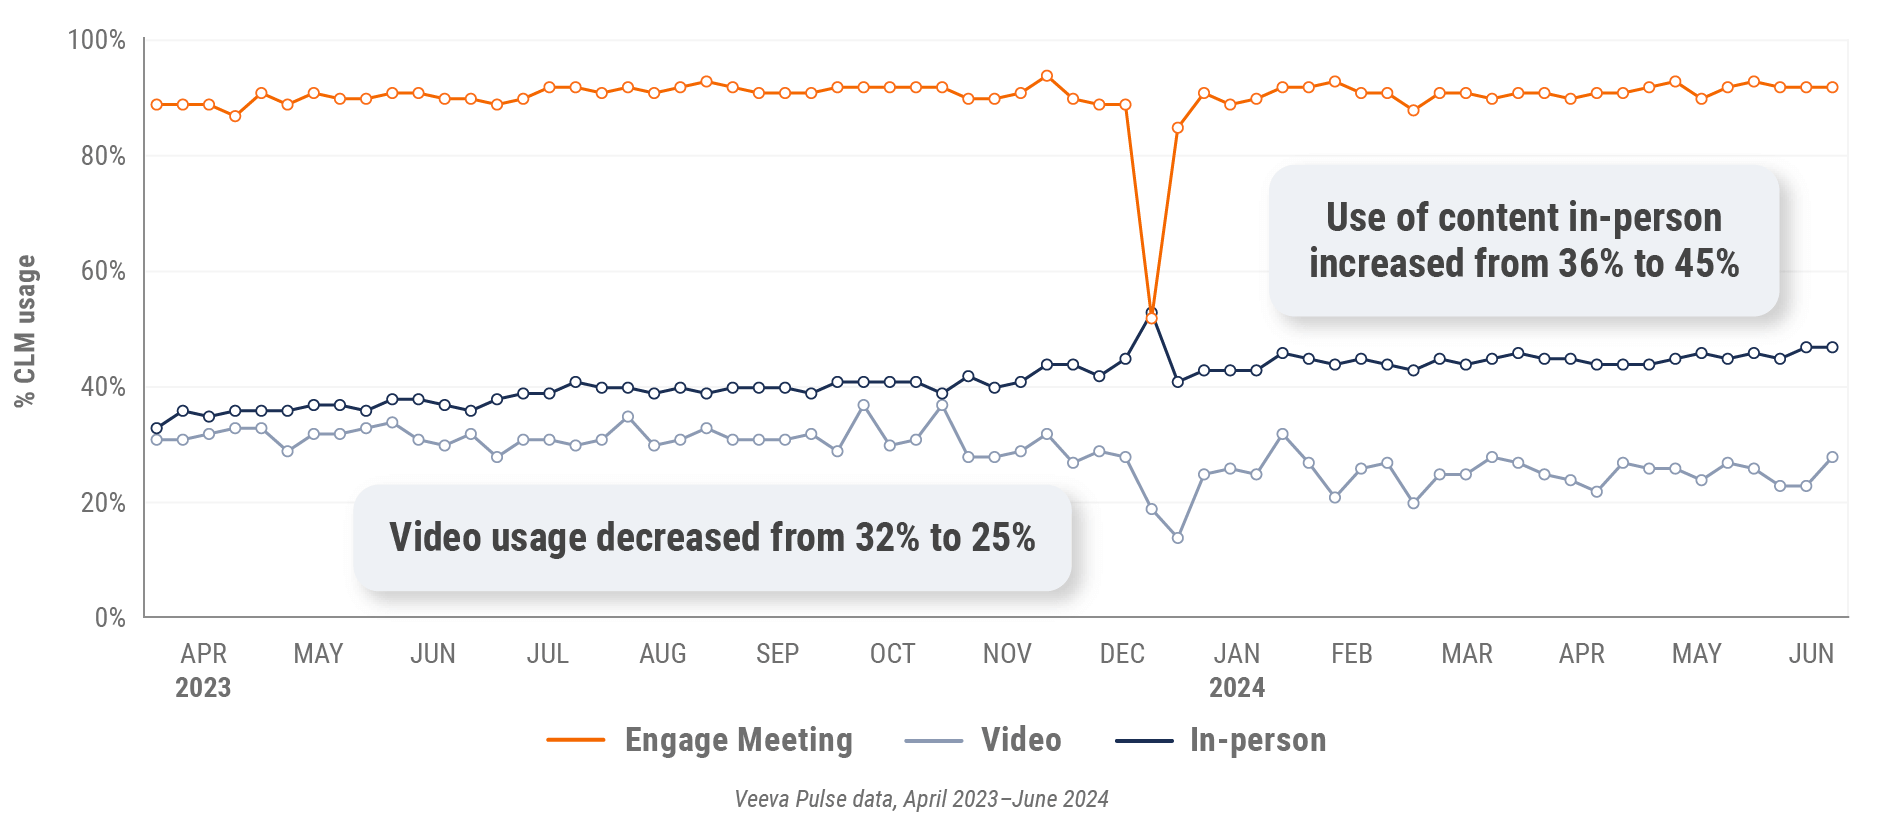
Figure 40: Veeva CRM Engage meeting duration, Latin America

*Multiple new LATAM pharma companies were added, increasing weekly activity volume.
Appendix: Data dictionary
Metric definitions
- Channel mix evolution over time: Weekly Veeva CRM activity volume broken down by the channel of engagement (in-person, phone, video, email, chat, or text)
- Channel mix: Total Veeva CRM activity volume broken down by engagement channel percentage
- Weekly activities per user: The average weekly number of Veeva CRM activities submitted per number of users active in Veeva CRM
- Approved email volume: Volume of approved emails sent via Veeva CRM
- Email open rate: Percentage of approved emails opened at least once out of all approved emails sent via Veeva CRM
- Email click rate: Percentage of approved emails clicked at least once out of all approved emails sent via Veeva CRM
- In-person % CLM usage: Percentage of in-person engagements that leveraged content in Veeva CRM
- Video % CLM usage: Percentage of video engagements that leveraged content in Veeva CRM
- Veeva CRM Engage meeting % CLM usage: Percentage of Veeva CRM Engage meetings that leveraged content in Veeva CRM
- Veeva CRM Engage meeting duration: The average duration of Veeva CRM Engage meetings in minutes
Engagement channel definitions
- In-person: Submitted calls with a CRM Standard Metrics call channel value of ‘in-person’
- Phone: Submitted calls with a CRM Standard Metrics call channel value of ‘phone’
- Video: Veeva CRM Engage calls and video calls via other platforms that are then recorded as calls in Veeva CRM with a Standard Metrics call channel value of ‘video’
- Email: Approved emails and emails sent via other platforms that are then recorded as calls in Veeva CRM with a Standard Metrics call channel value of ‘email’
- Chat or text: Submitted calls with a CRM Standard Metrics call channel value of ‘chat or text’
User type definitions
- Sales: Users that have been classified with the ‘sales’ value in the CRM Standard Metrics user type field
- Key account manager: Users that have been classified with the ‘key account manager’ value in the CRM Standard Metrics user type field
- Medical: Users that have been classified with the ‘medical’ value in the CRM Standard Metrics user type field
- Top global biopharma: Top 17 global biopharma companies by revenue
- Rest of industry: All other biopharmas
Region definitions
- Global: All markets globally. This quarter’s global trends report omits data from China.
- Europe: Albania, Andorra, Armenia, Aruba, Austria, Azerbaijan, Belarus, Belgium, Bermuda, Bosnia and Herzegovina,
Bulgaria, Croatia, Cyprus, Czech Republic, Denmark, Estonia, Finland, France, French Polynesia, Georgia, Germany,
Greece, Greenland, Guadeloupe, Guernsey, Hungary, Ireland, Italy, Jersey, Latvia, Lithuania, Luxembourg, Macedonia,
Malta, Martinique, Republic of Moldova, Monaco, Montenegro, Netherlands, New Caledonia, Norway, Poland, Portugal,
Romania, Serbia, Slovakia, Slovenia, Spain, Sweden, Switzerland, Ukraine, United Kingdom - Asia: Australia, Bangladesh, Bhutan, Brunei Darussalam, Cambodia, Cocos (Keeling) Islands, Indonesia, Japan,
Kazakhstan, Republic of Korea, Kyrgyzstan, Malaysia, Mongolia, Myanmar, Nauru, Nepal, New Zealand, Philippines,
Samoa, Singapore, Solomon Islands, Sri Lanka, Taiwan, Tajikistan, Thailand, Turkmenistan, Uzbekistan, Vietnam - Latin America: Antigua and Barbuda, Argentina, Bahamas, Barbados, Belize, Bolivia, Brazil, Chile, Colombia, Costa Rica, Cuba, Dominican Republic, Ecuador, El Salvador, Guatemala, Guyana, Haiti, Honduras, Jamaica, Mexico, Nicaragua, Panama, Paraguay, Peru, Trinidad and Tobago, Uruguay, Venezuela. Multiple new LATAM pharma companies were added, increasing weekly activity volume.
Methodology
The Veeva Pulse Field Trends Report is a quarterly industry benchmark for global and regional healthcare professional
(HCP) engagement across the life sciences industry. The report is based on approximately 600 million annual global
field activities captured in Veeva CRM and Veeva CRM Engage, along with more than three million curated profiles from
Veeva Link Key People and global reference data of HCPs and HCOs in 65+ countries from Veeva OpenData. In addition, this study utilized anonymous patient longitudinal claims data from Veeva Compass
Patient covering dispensed prescriptions, procedures, and diagnoses from more than 300 million patients.
The Veeva Pulse Field Trends Report delivers insights that inform the industry and help field teams align their strategy to
key market trends for improved commercial success. The global Veeva Business Consulting team also helps customers
inform their strategies using industry benchmarking with Veeva Pulse data.
*All trending chart insights (except Figure 7) are calculated using an average weekly percent change during the specified time period.