Industry Report
Veeva HCP 360 Trends Report
The Q4 2025 HCP 360 Trends Report focuses on the top uses of AI in commercial biopharma. Practical AI agents help rapidly deliver scientific data and strengthen relationships with HCPs.
The Most Impactful Ways Biopharma Will Use AI This Year to Accelerate Treatment Adoption
AI makes it possible to deliver excellent customer engagement. The ability to reach the right healthcare professionals (HCPs) and patients with life-changing scientific data and content, via the best role or channel, has never been closer:
- Free Text Agent uncovers deep insights from interactions — such as a customer’s specific adoption barriers or reactions to new information — and shares them compliantly across teams.
- Pre-call and Media Agents surface insights and support content engagement, not just creation, to narrow a costly gap: Effective content usage can double patient starts, yet field teams share it in just 48% of meetings. AI solves this by surfacing relevant content and synthesizing tailored talking points based on an HCP’s cross-team and cross-channel engagement.
- Voice Agent uses the human voice as a CRM interface, recording and transcribing notes and follow-up actions, so important insights and tasks are not missed.
However, AI alone is not enough to overcome operating model and collaboration challenges. Some 71% of top 20 biopharma executives report that legacy operating models prevent true cross-team collaboration.
Successful companies will evolve their operations to meet this moment, starting with shared sales, marketing, and medical goals aligned with the HCP experience. By doing so, AI’s capabilities can scale — automating sequencing within a collaborative structure to improve customer relationships and deliver treatment to patients faster.
Read more about the drivers and barriers of commercial transformation with AI in our Veeva HCP 360 Trends Report.

Dan Rizzo
VP, Global Head of Business Consulting

Free text is the foundation needed for seamless HCP engagement
Field teams are the most direct and expensive way to build customer relationships. Yet most companies miss deep insights by using drop-down values to record meeting notes, mainly due to compliance concerns. Highly valuable engagement insights — such as the HCP’s true intent, sentiment regarding new data, or specific adoption barriers — should be captured in rich, narrative free text.
AI is creating a new foundation for omnichannel engagement by:
- Allowing teams to record the full context and nuance of their discussions with HCPs without worrying about compliance concerns
- Scanning text before submission to identify and flag potential non-compliant entries, such as unapproved therapeutic claims or private patient data
- Giving users in-the-moment coaching by requesting the removal of sensitive content, elevating their understanding of compliance rules
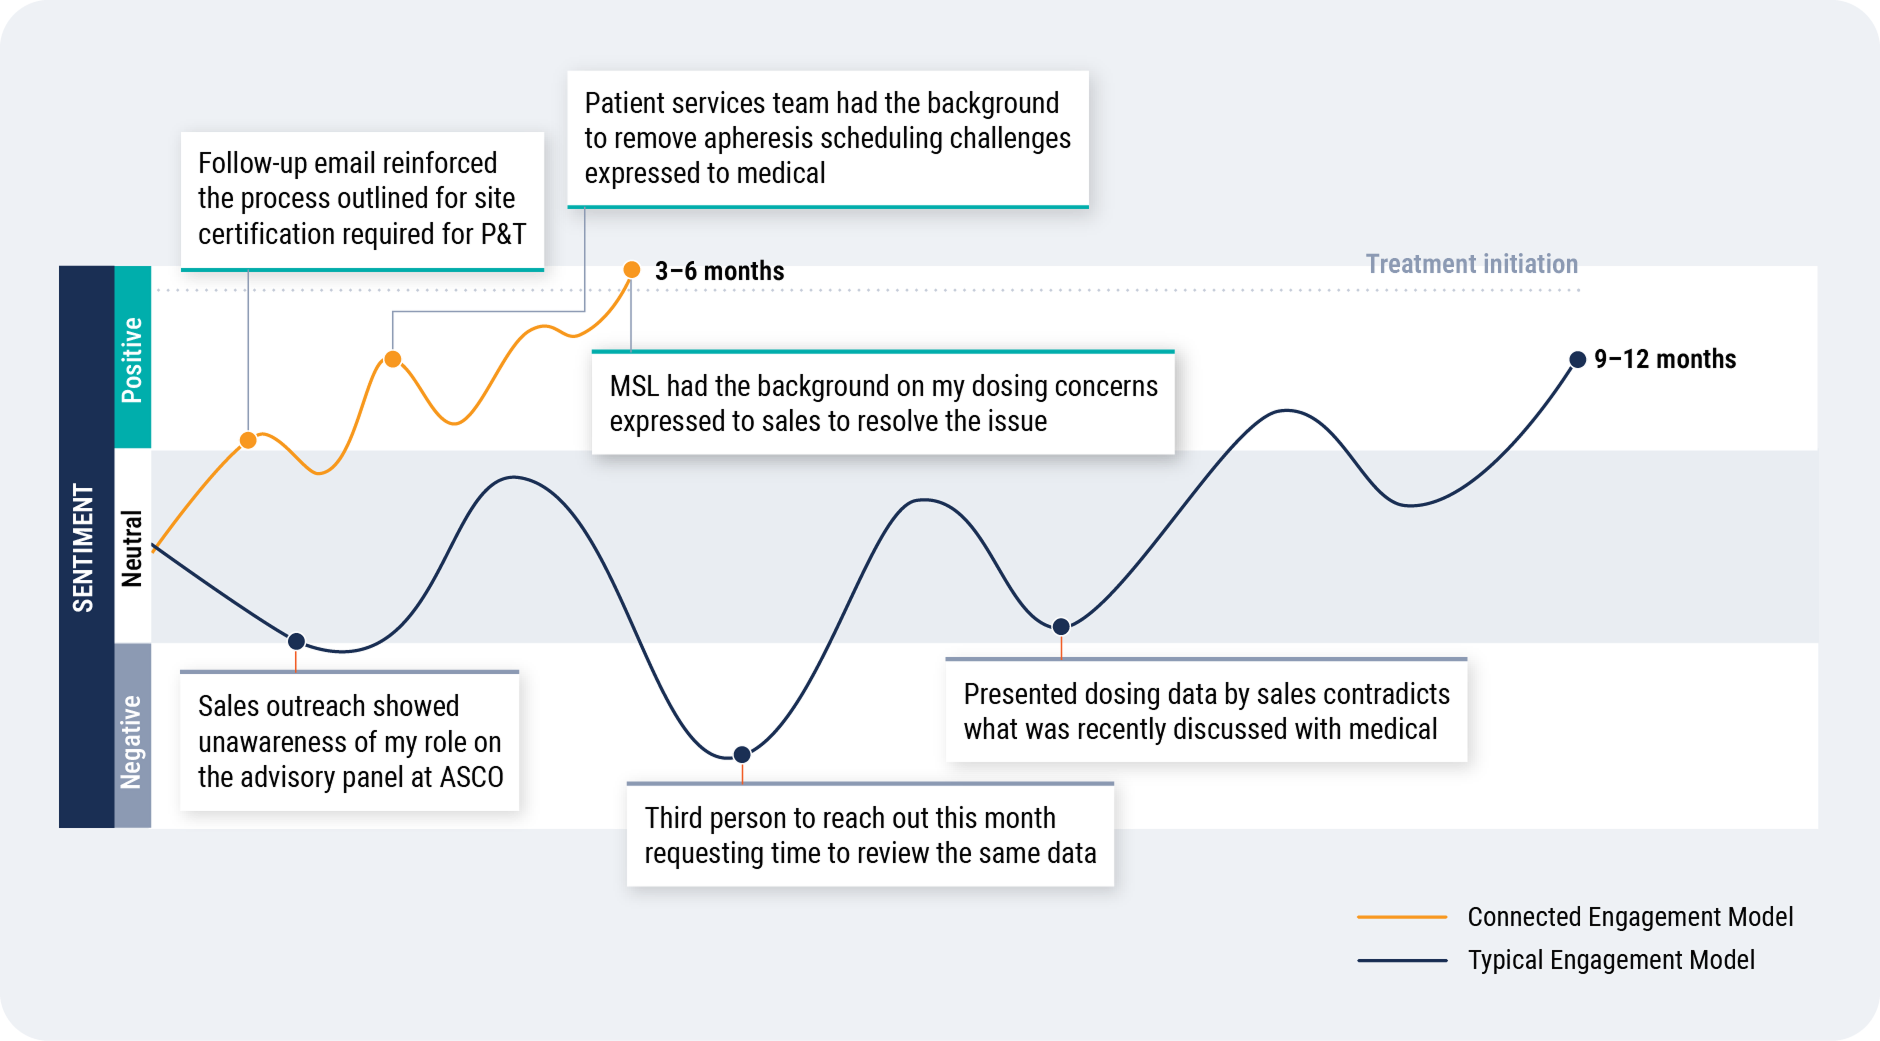
Compliant free text helps remove engagement blind spots
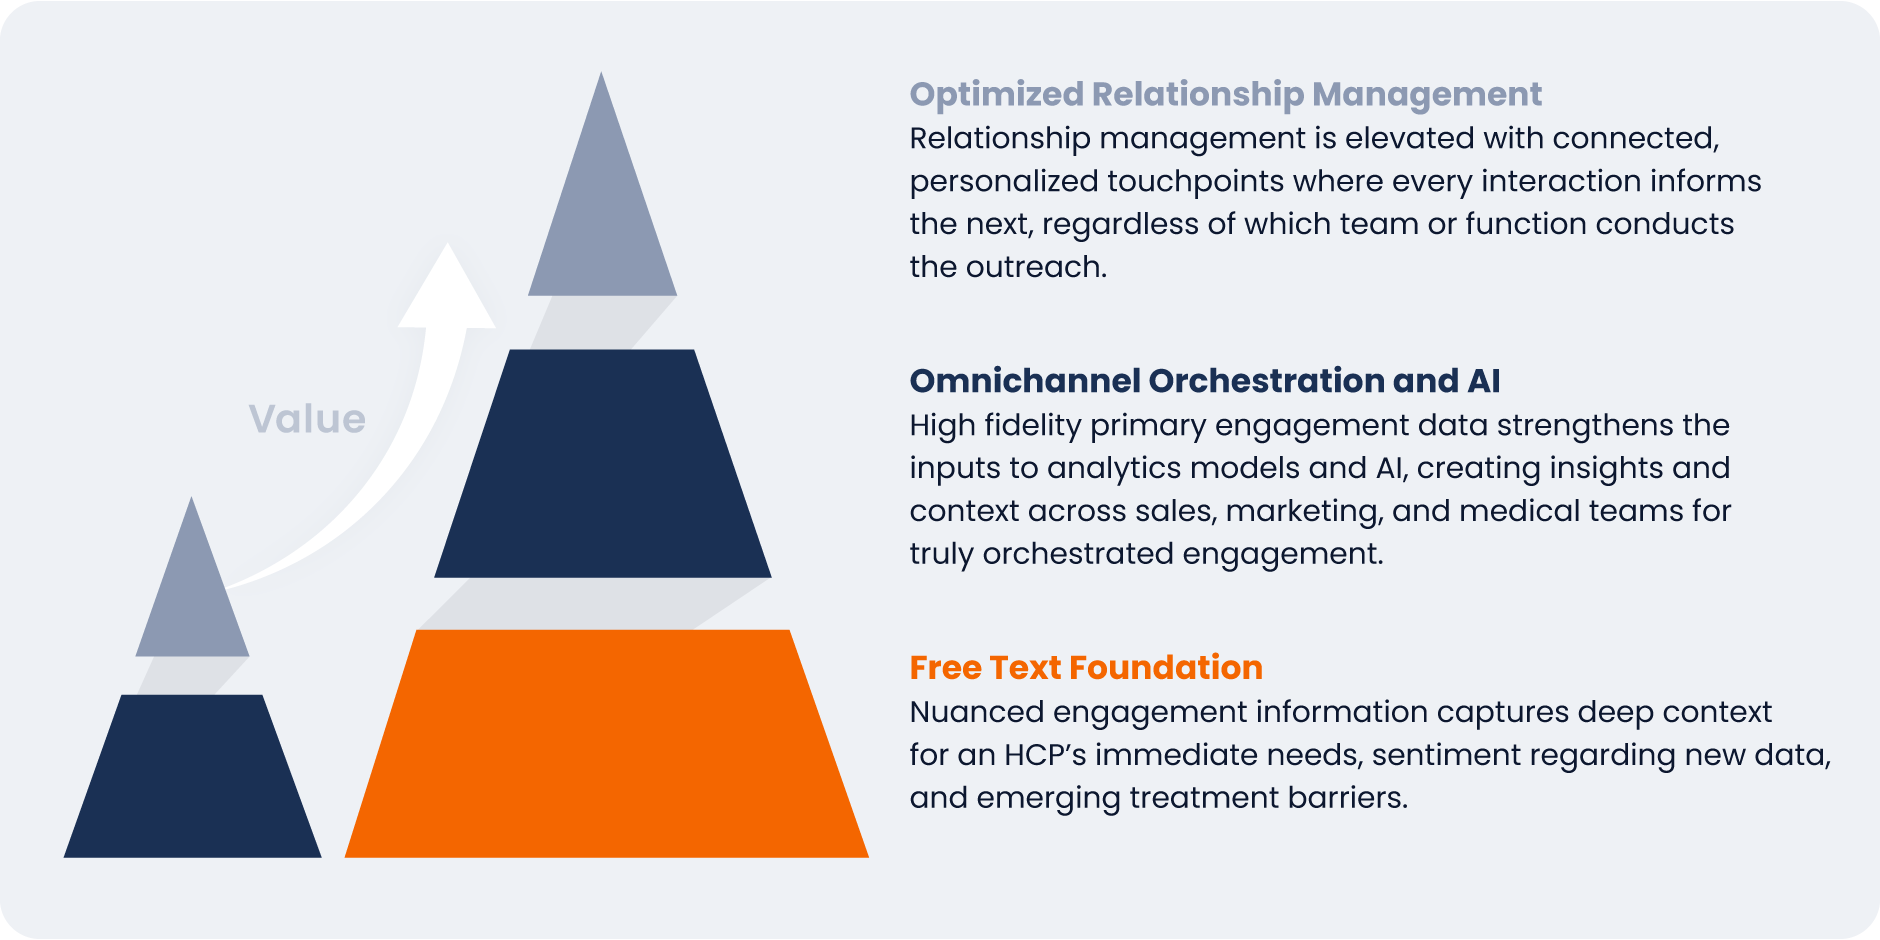
Effectively capturing and using deep, contextual customer data is the foundation for an engagement model that is connected, personalized, and truly orchestrated across sales, marketing, and medical. Early adopters of the AI agent for compliant free text are taking a structured, phased project approach.
Using AI for content engagement, not just creation, is essential
AI for content creation holds great potential — with speed, relevance, and compliance topping the list of biopharmas’ most anticipated benefits. But first, the industry must address a usage gap. Roughly 80% of approved content goes unused by the field team despite Veeva HCP 360 data showing that engagements with shared content result in more than double the new patient treatment starts.
Benefits of relevant and timely content-sharing
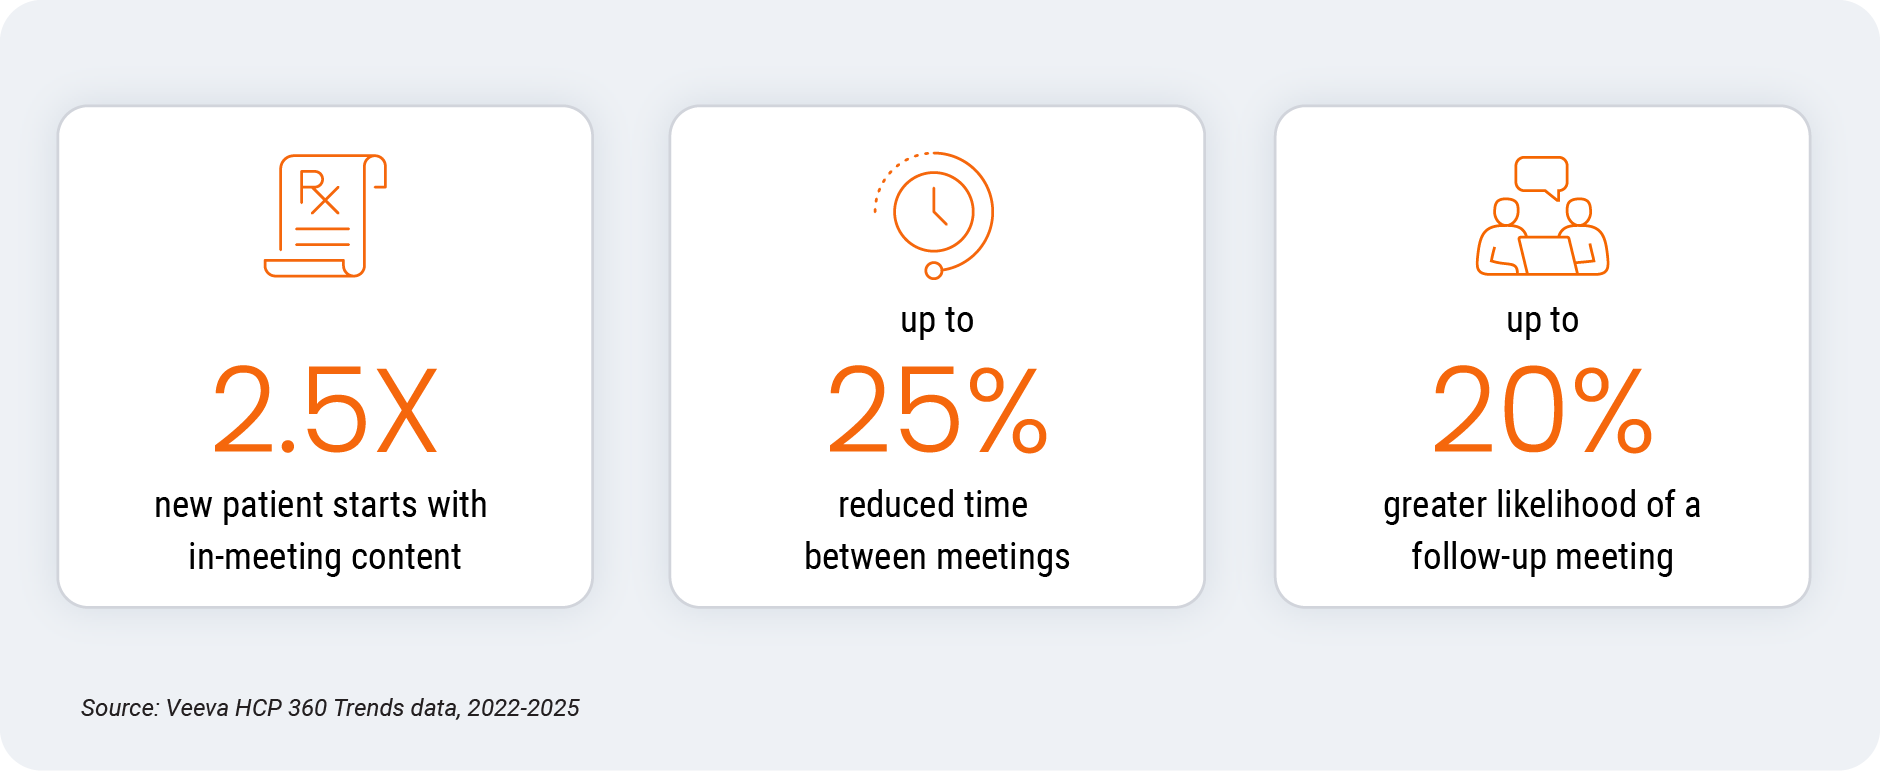
There is a clear disconnect between content creation strategies and field execution: Content volume is rising as the industry craves highly personalized and impactful material. Yet field teams use content in less than half of meetings.
AI agents help organizations increase engagement with content by connecting the dots across previous engagements and treatment inflection points, surfacing relevant assets for the most impactful interactions.
Start with practical steps: Establish clear and measurable goals with investments that align to advancing HCPs along their journey. Train field users with a focus on content engagement, and feed data and insights back to marketing to refine the approach and inform the next creation round.
Setting joint medical-commercial KPIs creates a structure to maximize AI
Field medical education prior to launch improves treatment adoption by 50%, demonstrating how HCPs and patients benefit when medical-commercial teams align to deliver data and content in the moment of need.
However, few organizations have established metrics for jointly serving customers with aligned messages in a coordinated way. Legacy compliance concerns are often cited as standing in the way, yet 71% of top 20 biopharma executives say their operating model prevents effective cross-team collaboration.
Creating shared KPIs sets up AI agents to help automate teaming, surfacing insights and content so each interaction with an HCP informs the next. With a collaborative organizational structure and a connected data foundation in place, AI better automates sequencing across sales, marketing, and medical.
Shared goals rewarding faster journey progression accelerate treatment
Begin by establishing shared KPIs, then pull through operations and incentive changes with executive sponsorship to address silos and compliance concerns.
Connect with Veeva Business Consulting to maximize your field team’s AI usage and improve HCP engagement, with insights from HCP 360 Trends.
Global and Regional Trends
This report highlights global and regional field engagement trends from Veeva HCP 360 data gathered between January 2025 and December 2025. Veeva HCP 360 data is sourced from Veeva’s aggregated CRM activity, including field engagement stats from all instances of Veeva CRM globally. In this report, comparisons in trending charts are year over year, Q4 2024 to Q4 2025, while non-trending charts contain quarter-over-quarter comparisons, Q3 2025 to Q4 2025.
Global trends*
Figure 1: Channel mix evolution, global
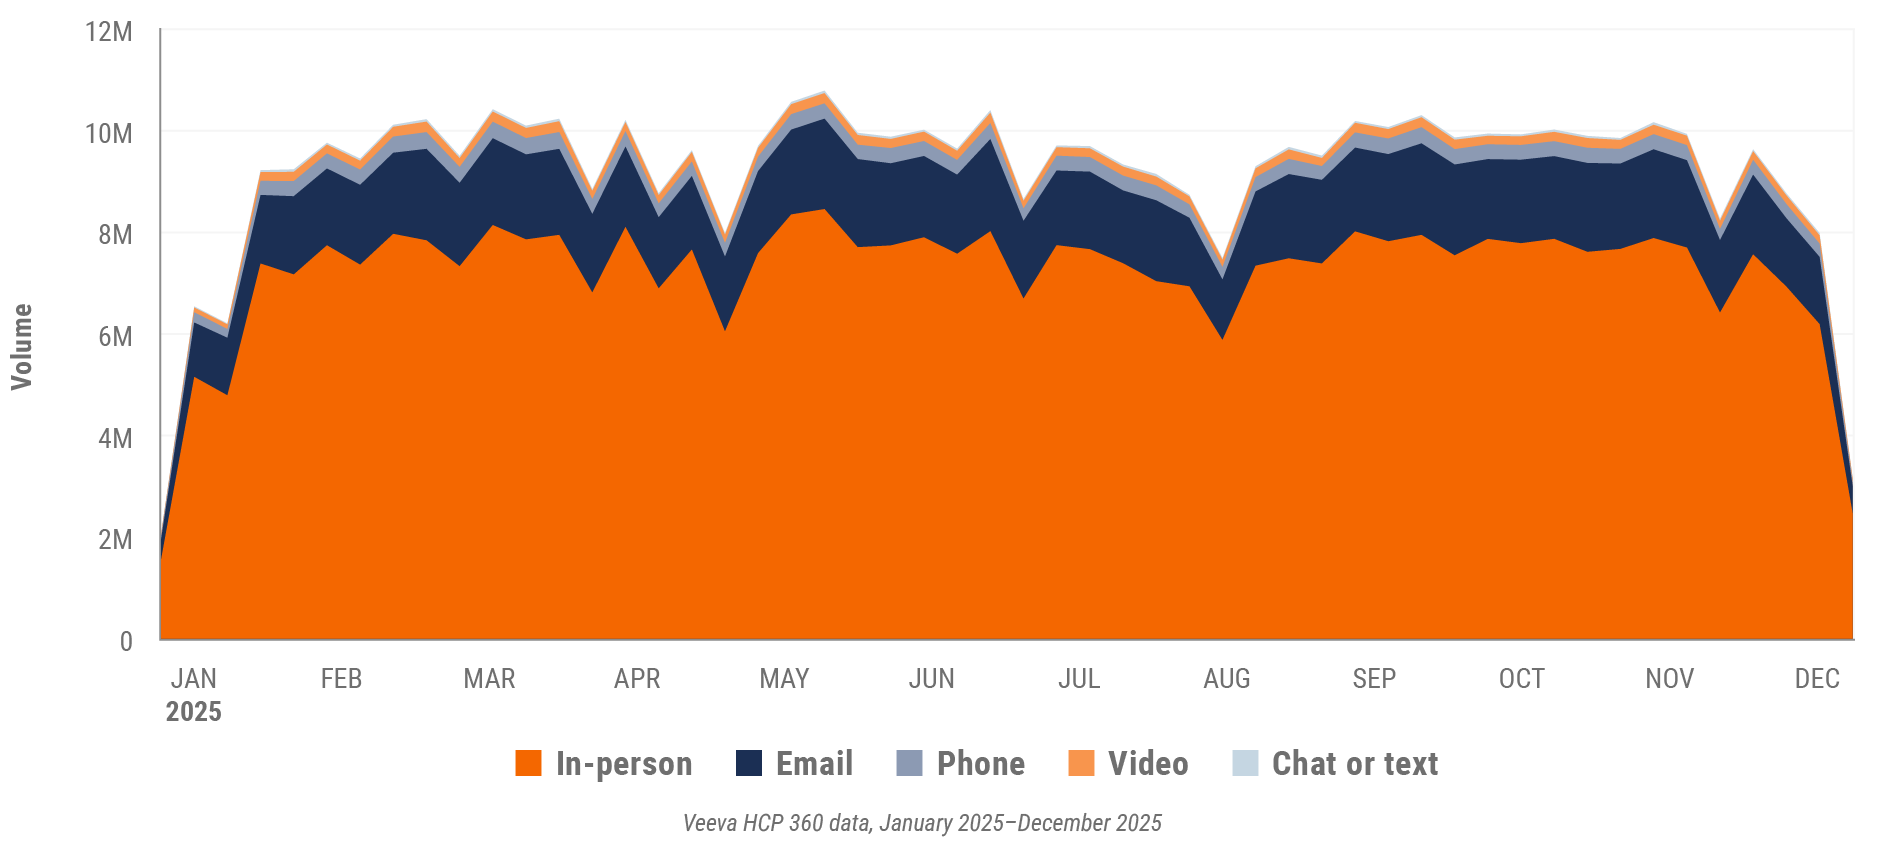
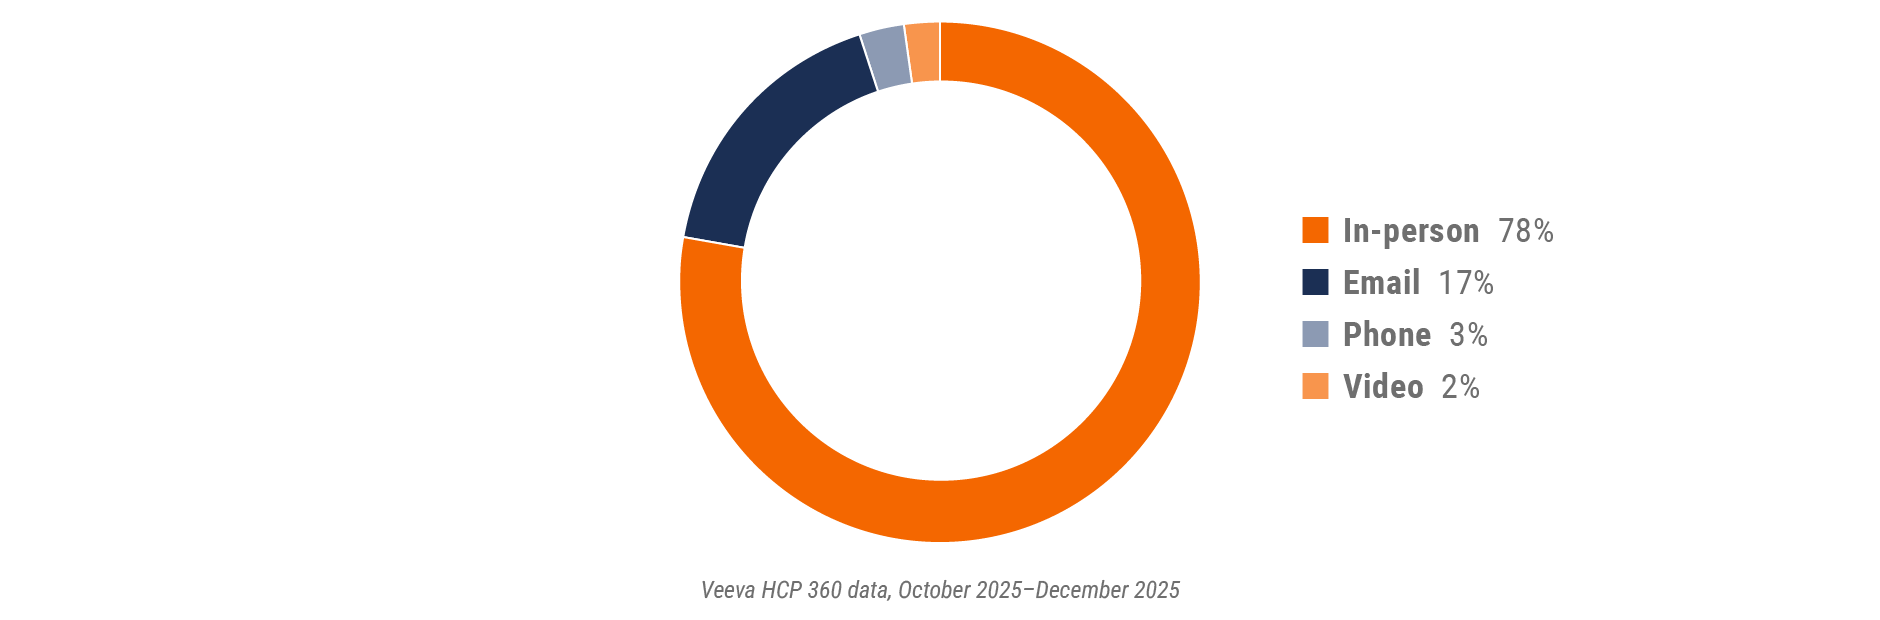
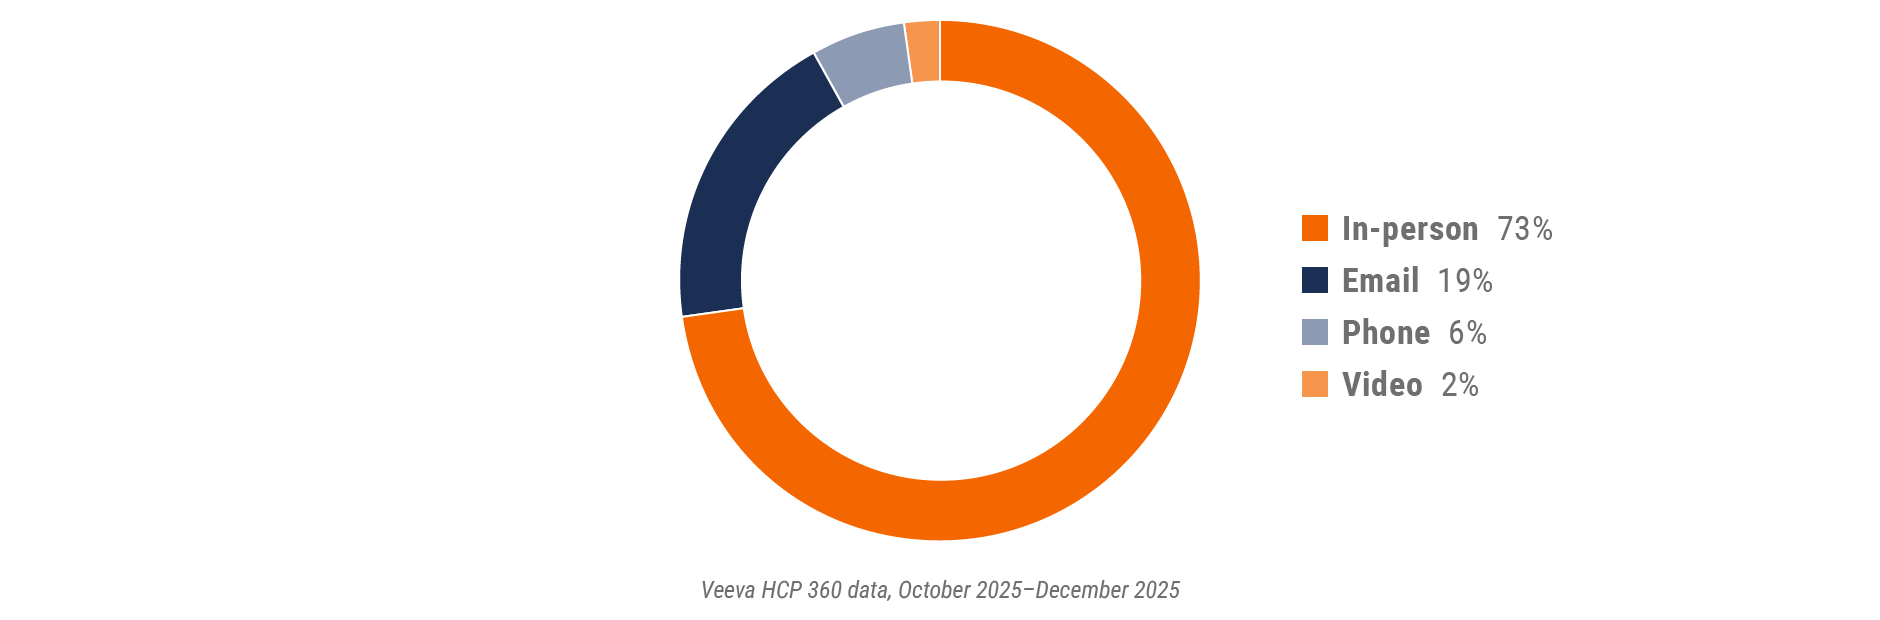
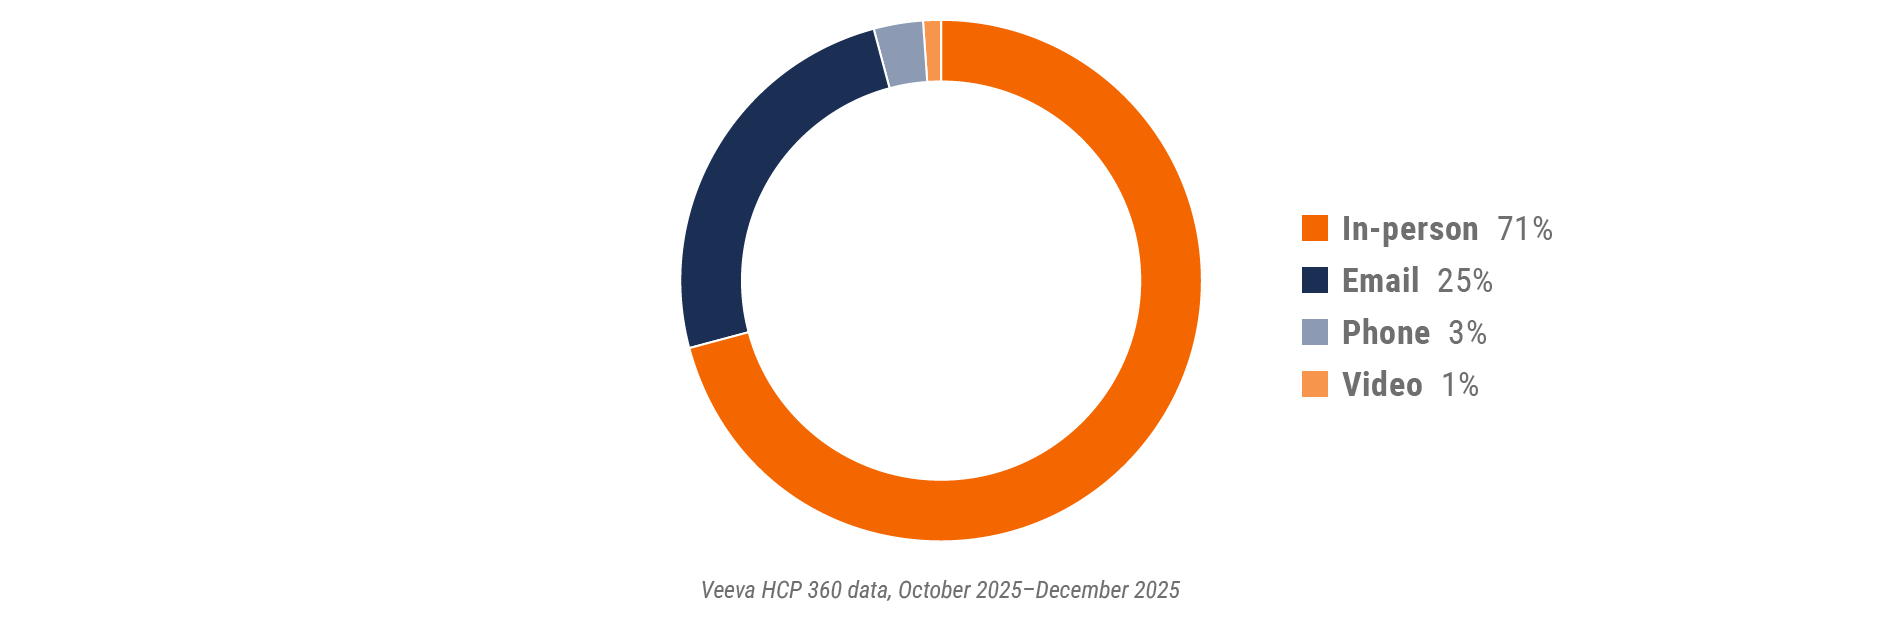
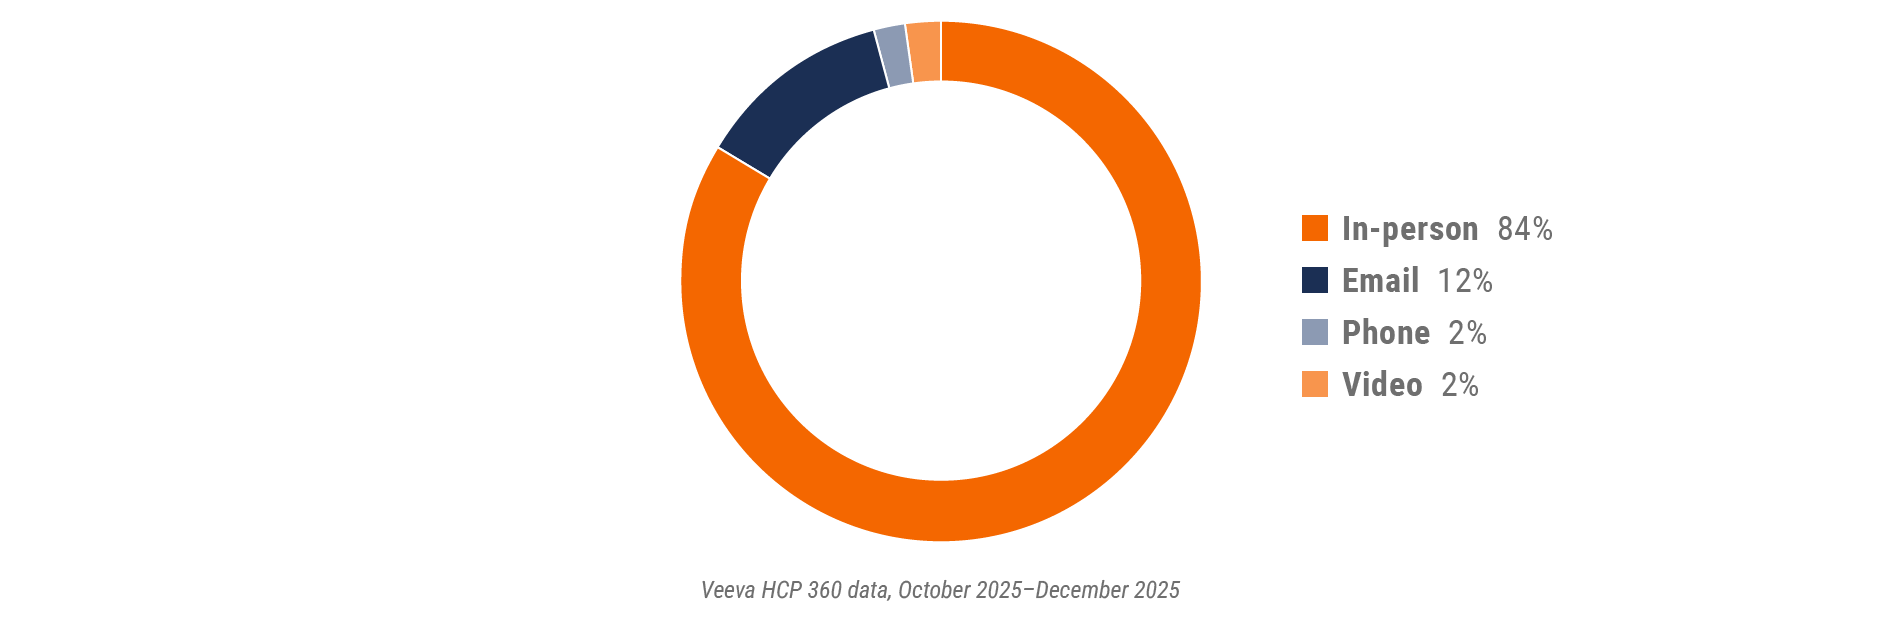
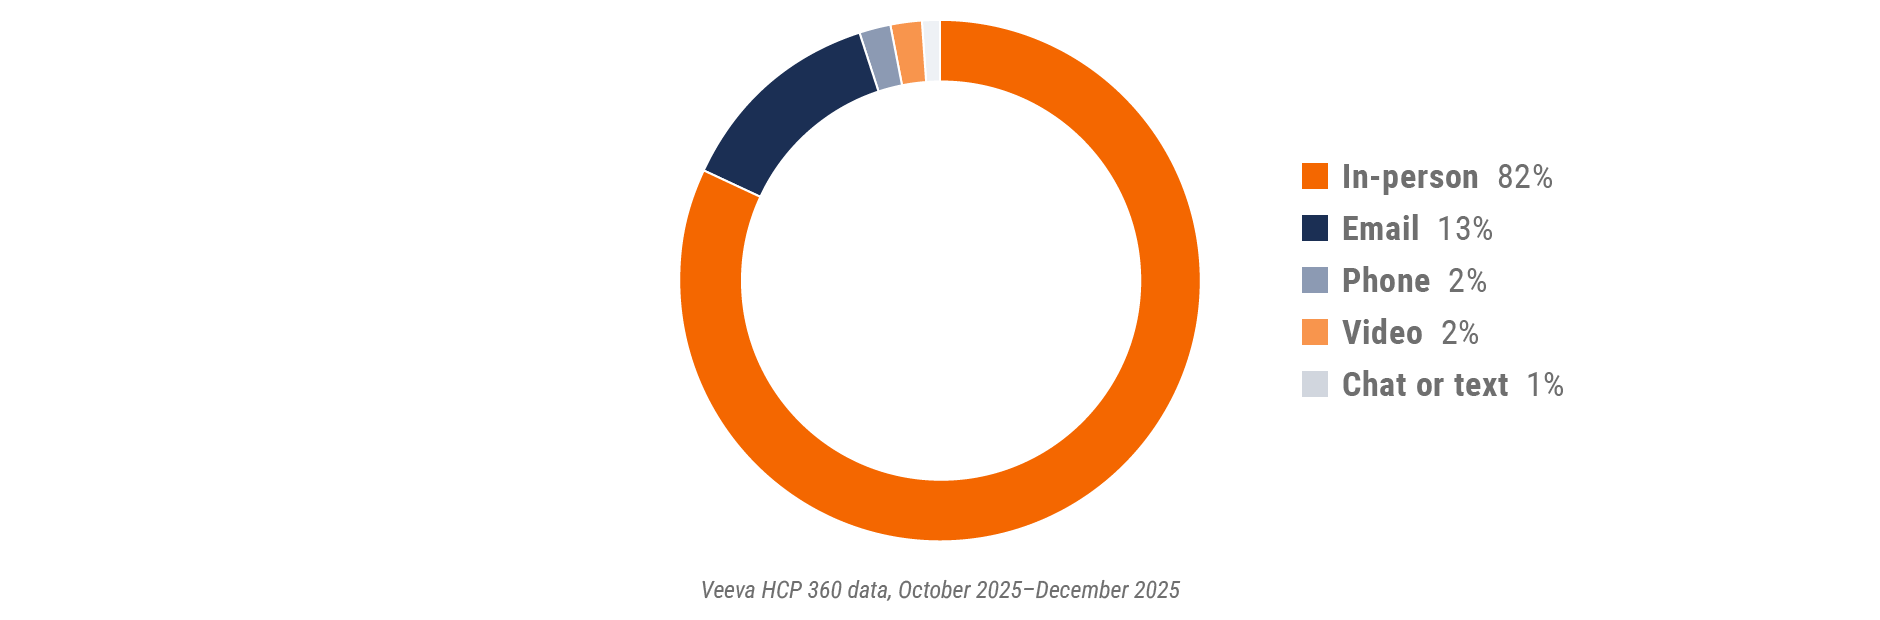
Figure 2: Channel mix, global
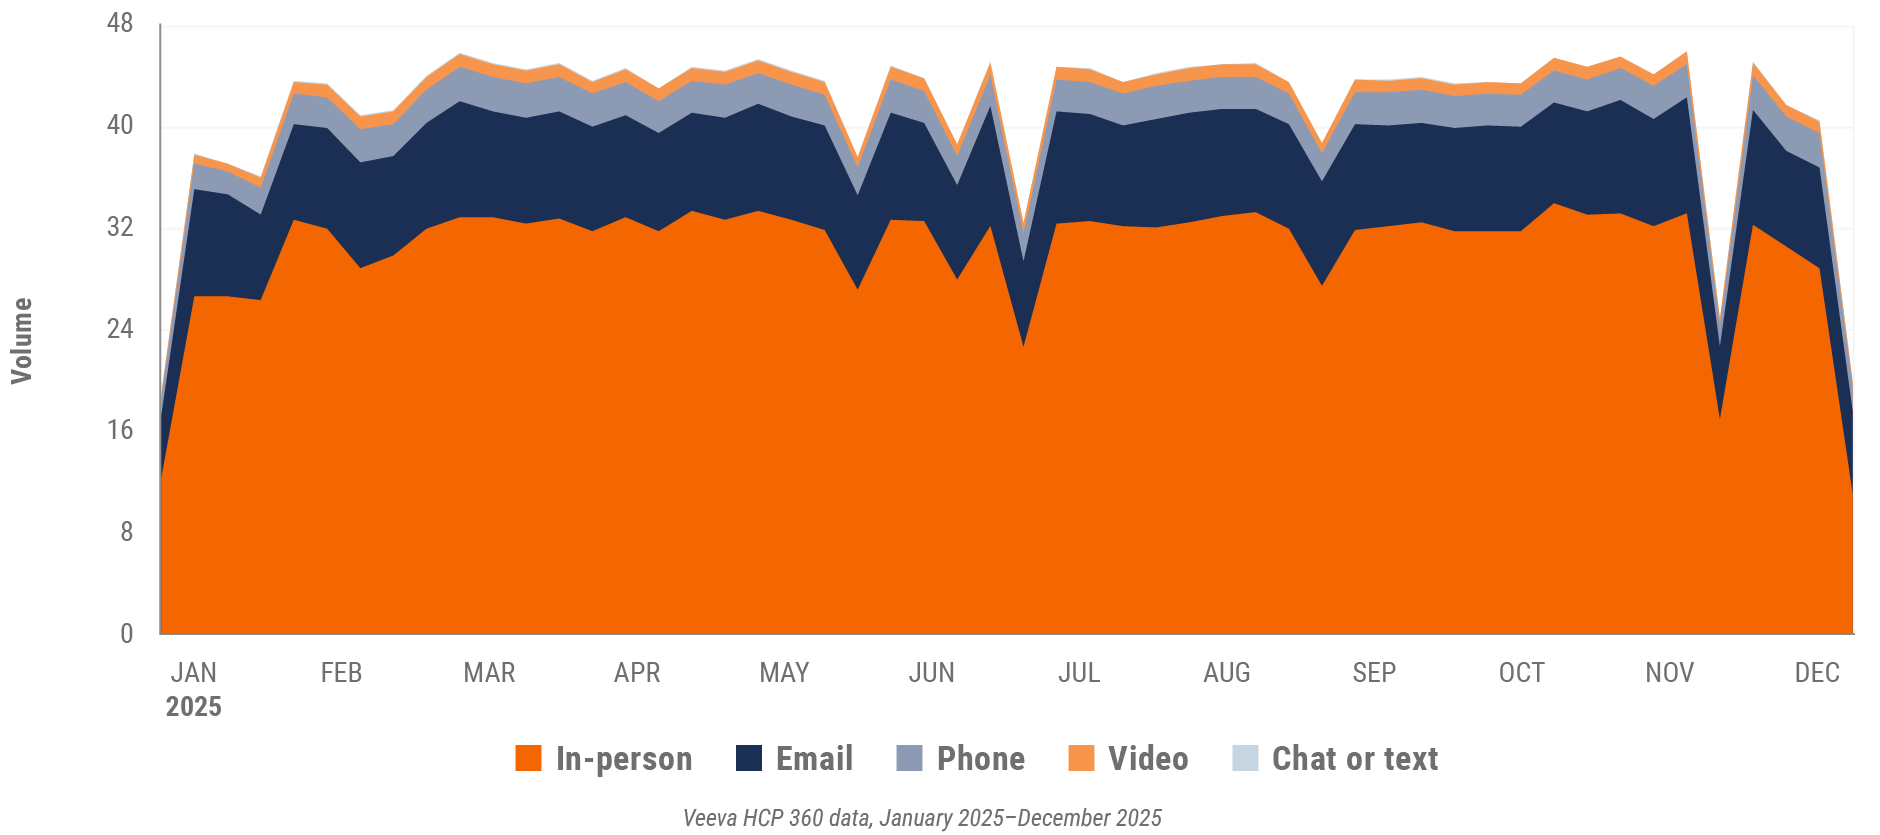
Global field team activity Weekly activity per user by engagement channel
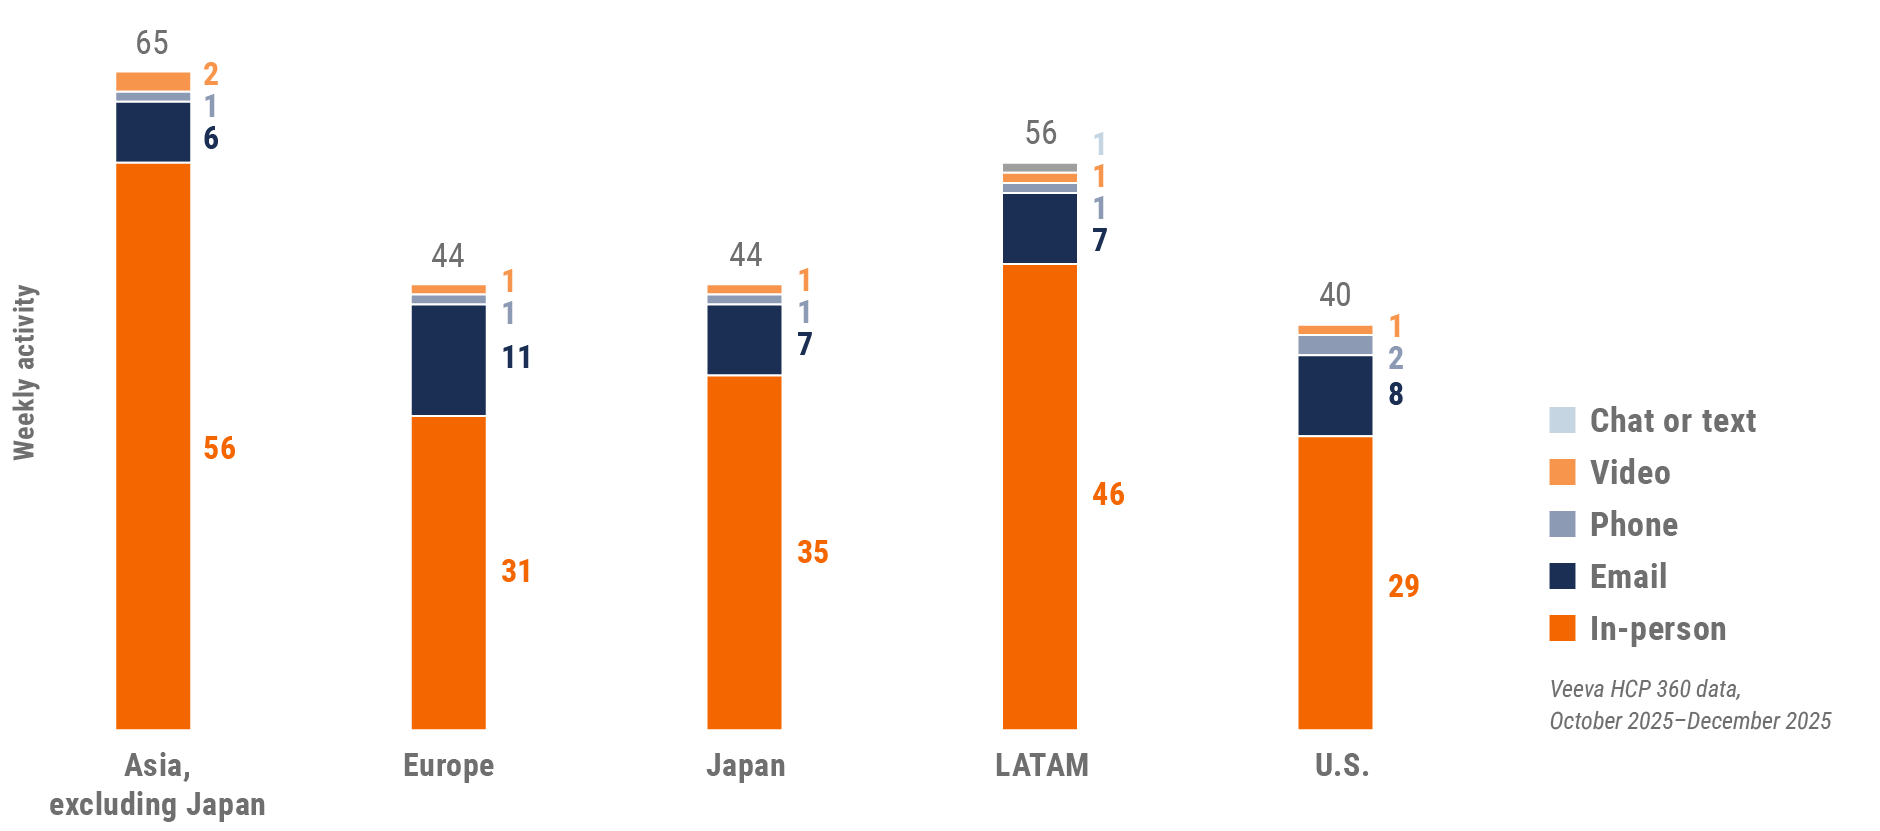
Figure 3: Activity by region, global
Global engagement quality Consolidation of key quality metrics
Figure 4: Approved email volume, global
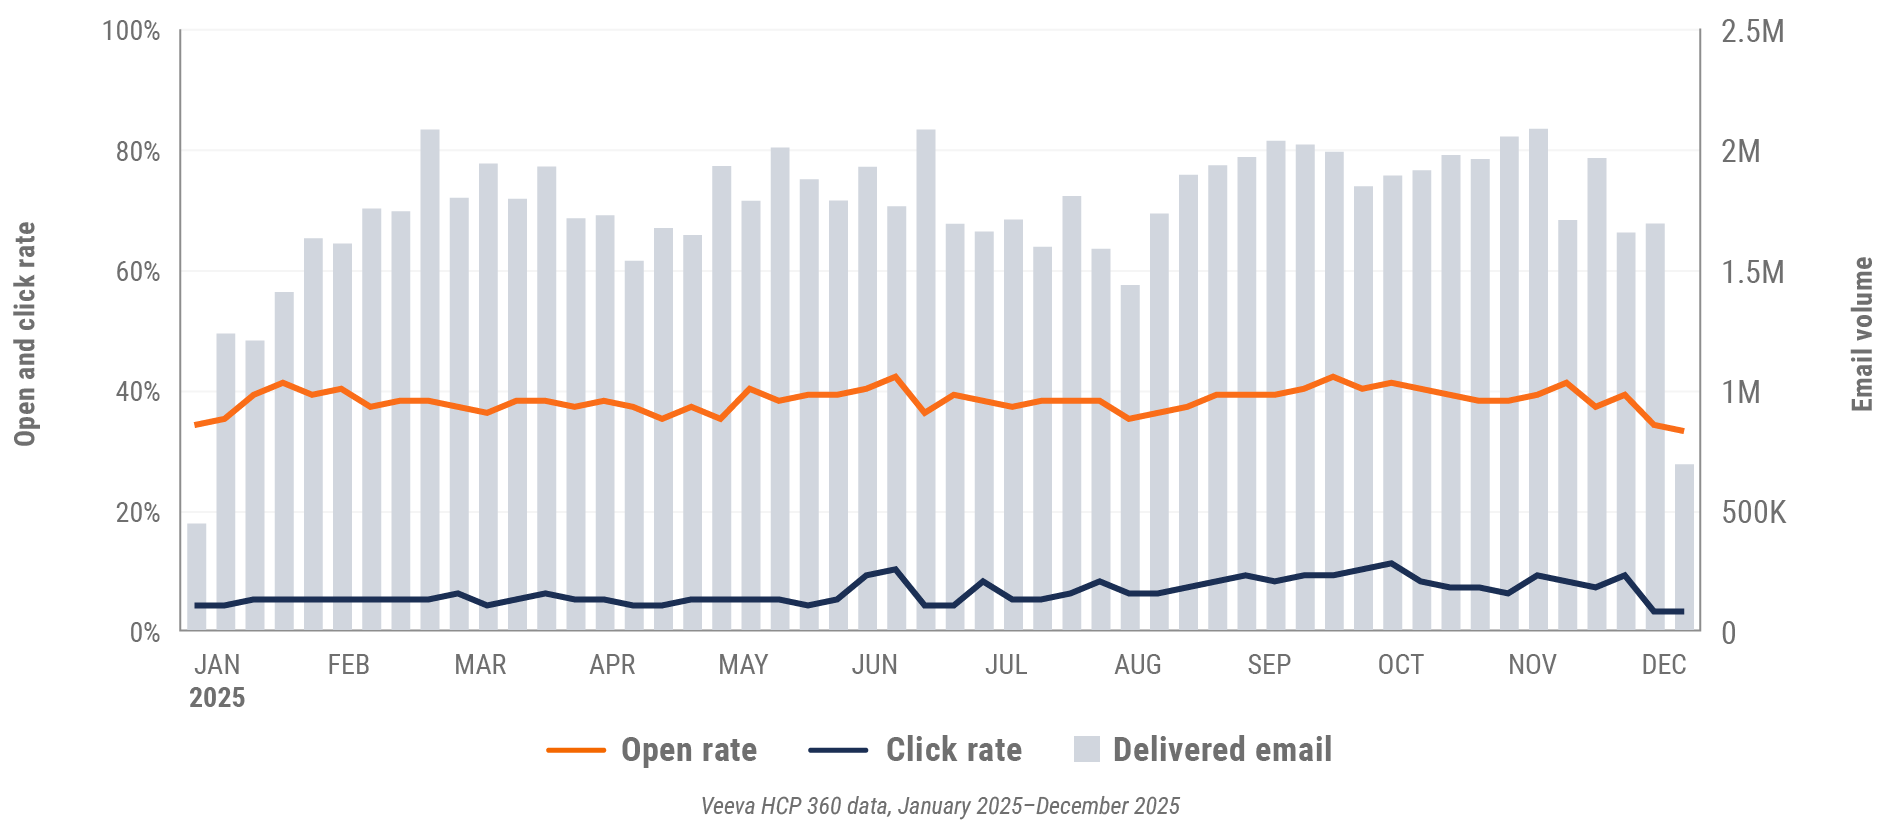
Figure 5: Content usage by channel, global
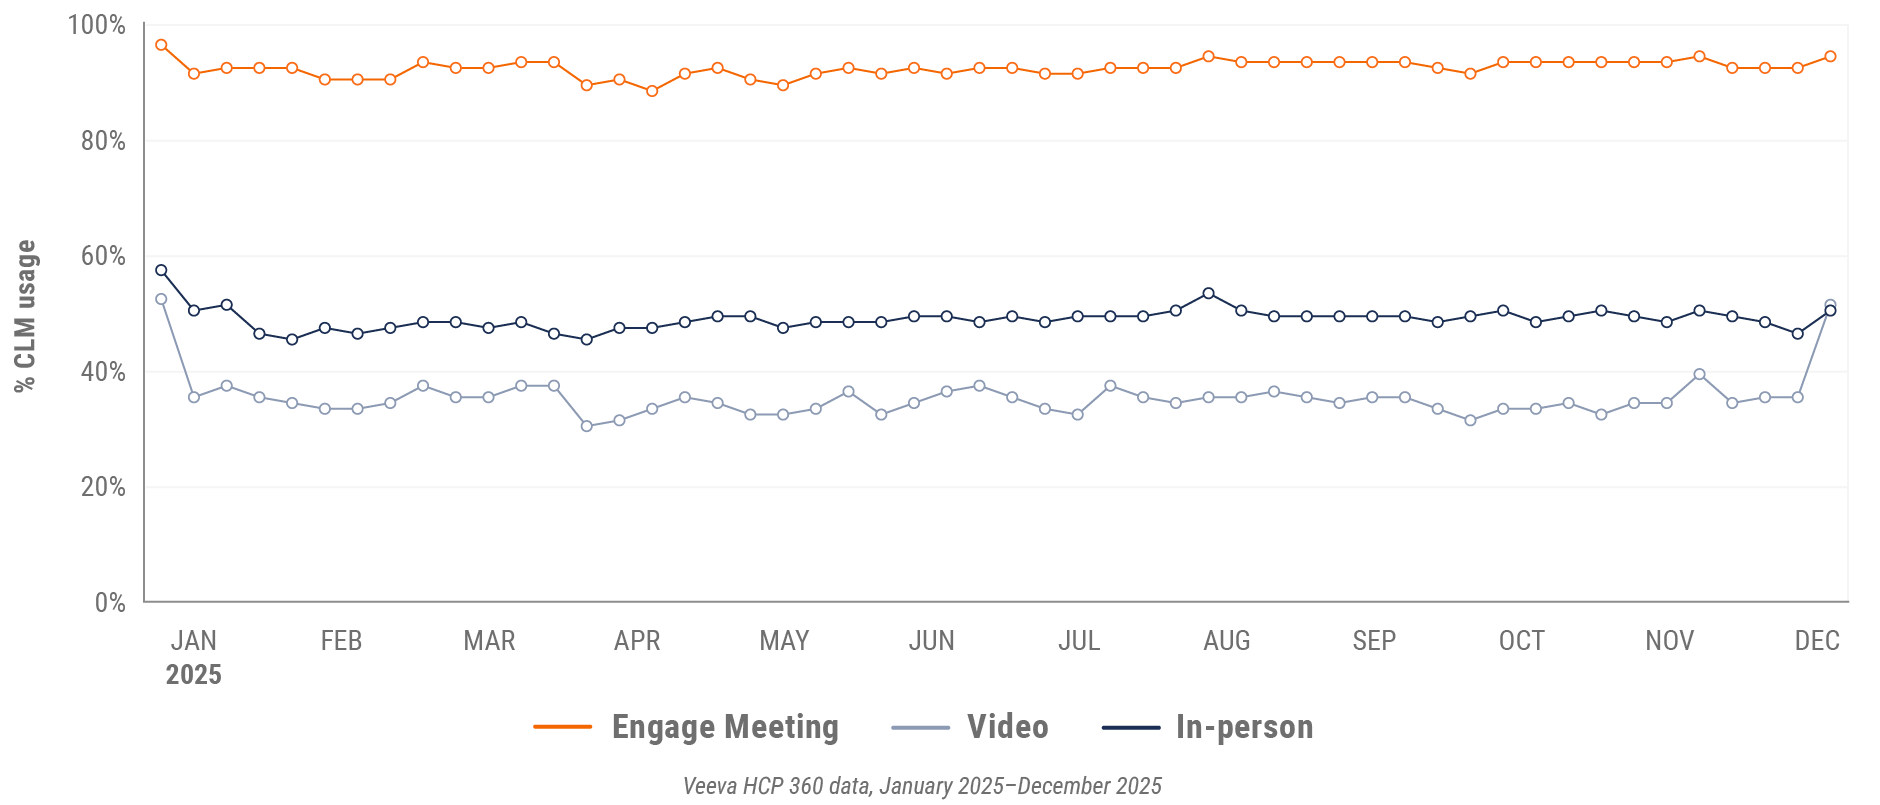
Figure 6: Veeva CRM Engage meeting duration, global

*This quarter’s global trends report omits data from China.
U.S. market trends
Figure 7: Channel mix evolution, U.S.
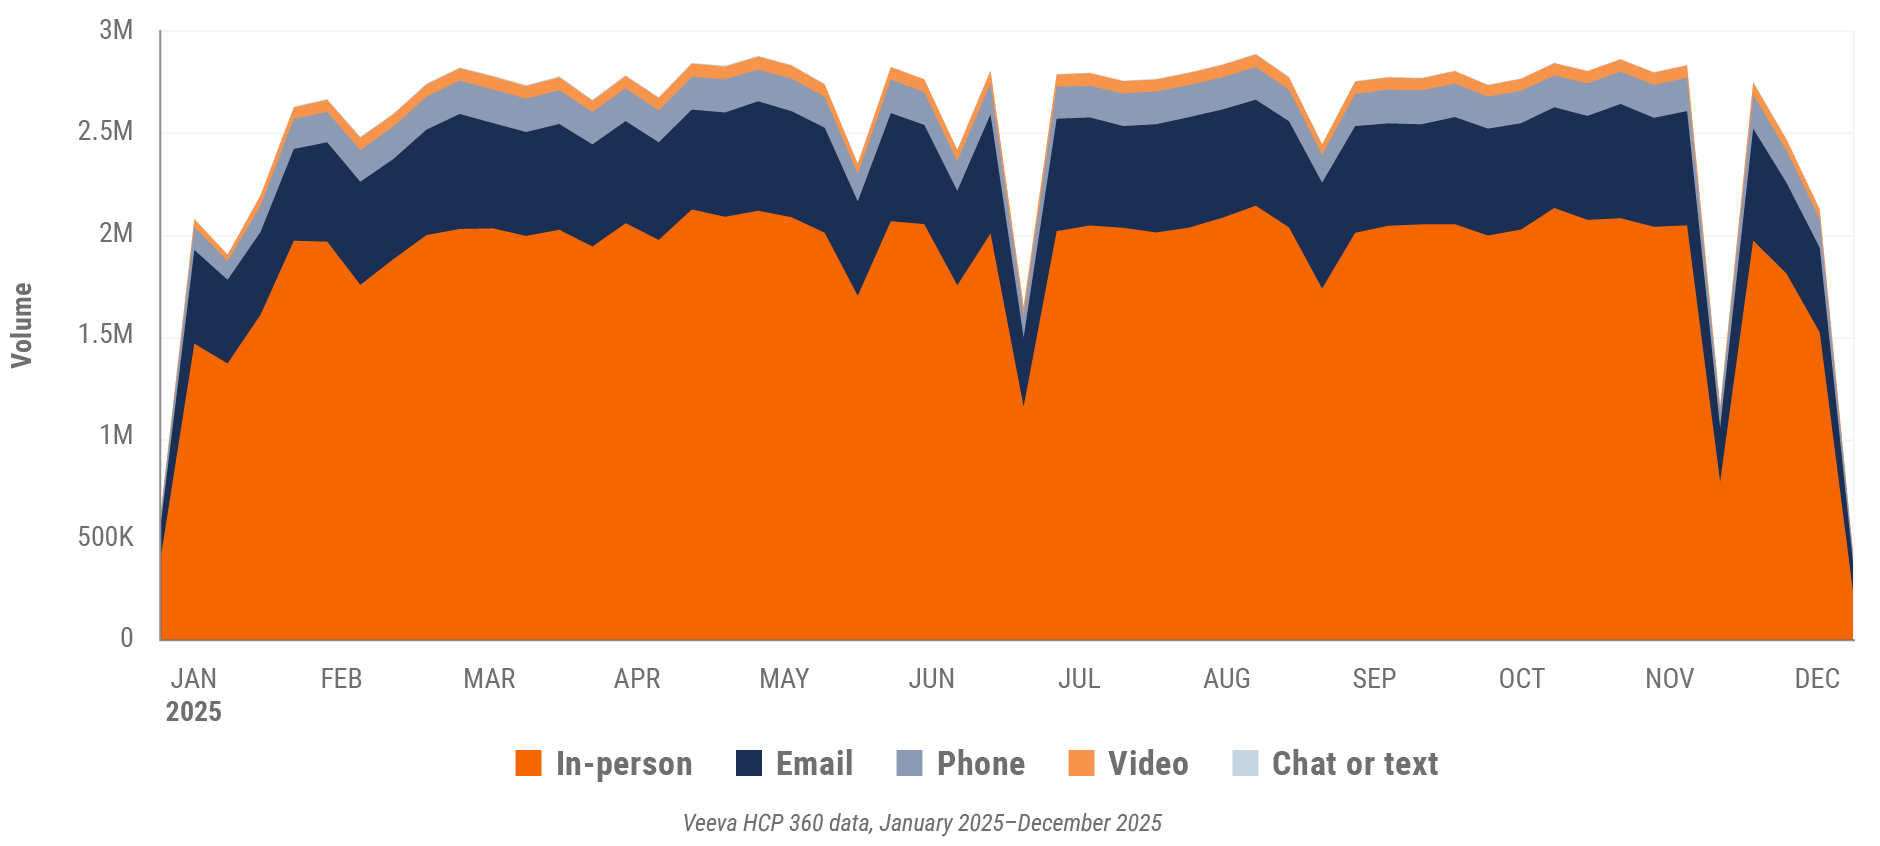
Figure 8: Channel mix, U.S.
U.S. field team activity Weekly activity per user by engagement channel
Figure 9: Activity, U.S.
U.S. engagement quality Consolidation of key quality metrics
Figure 10: Approved email volume, U.S.
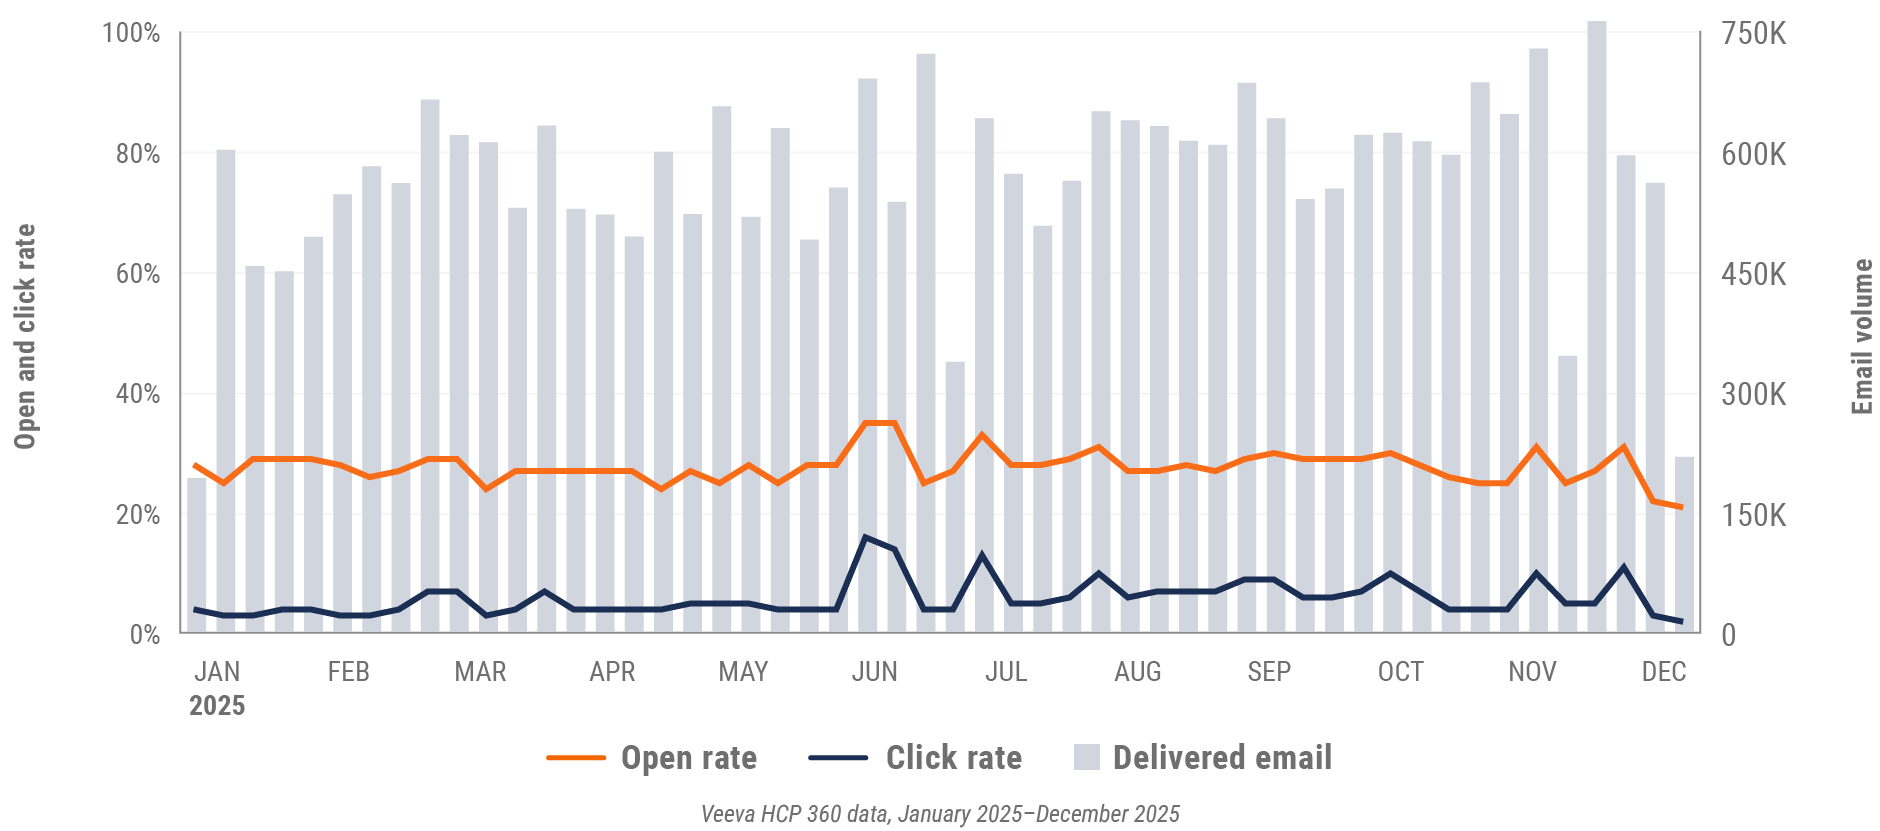
Figure 11: Content usage by channel, U.S.
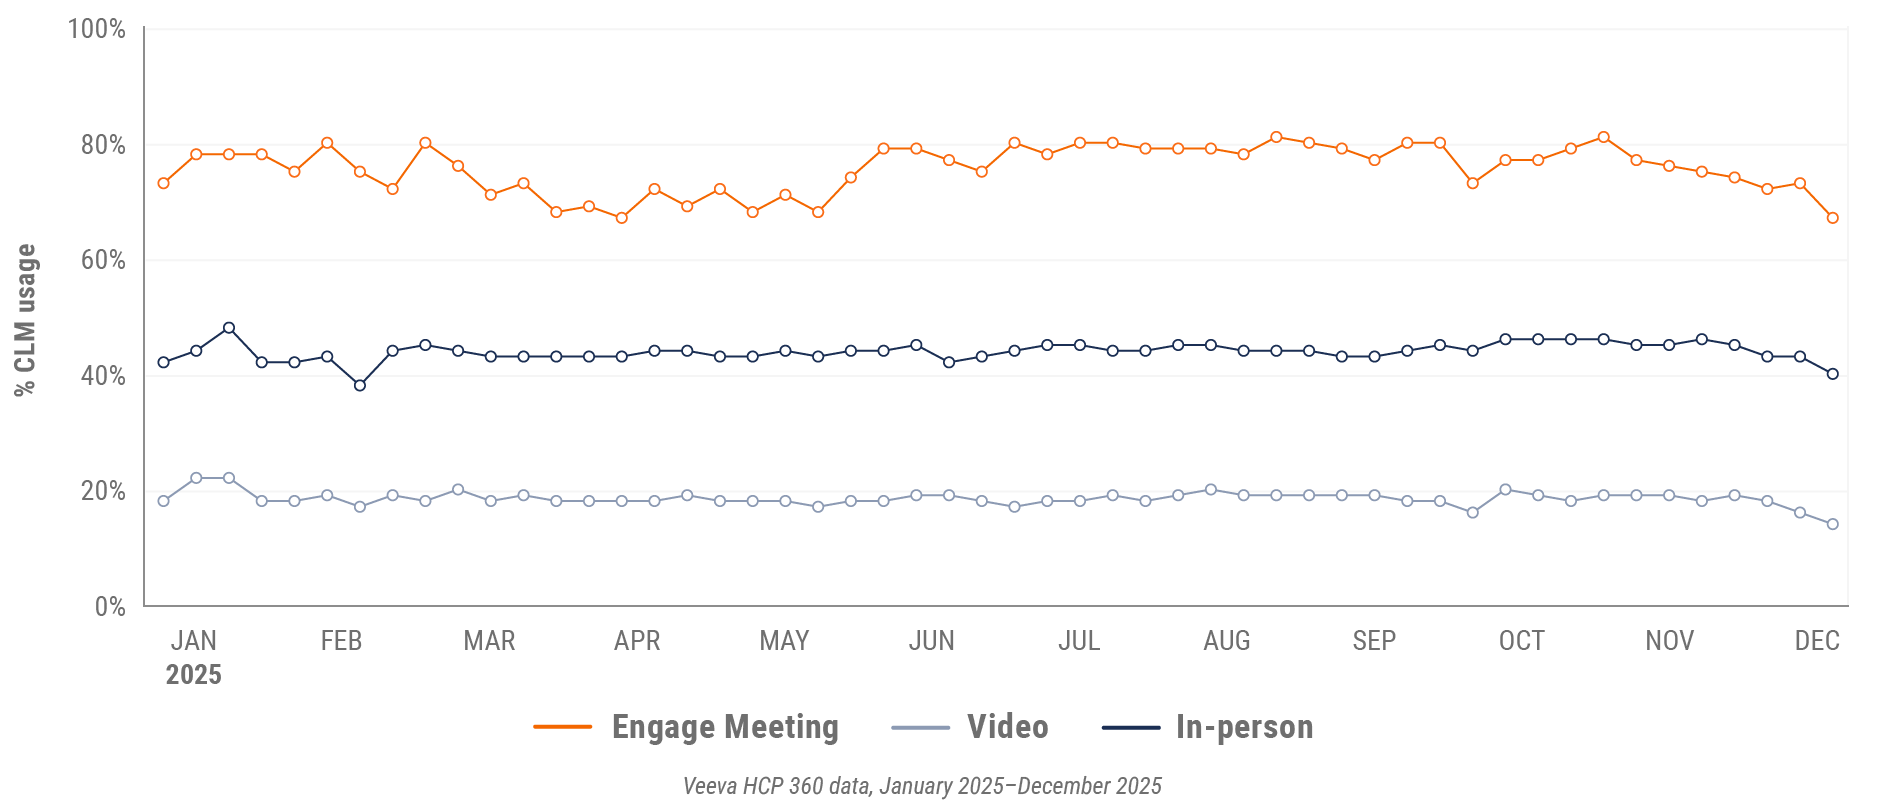
Figure 12: Veeva CRM Engage meeting duration, U.S.

Europe market trends
Figure 13: Channel mix evolution, Europe
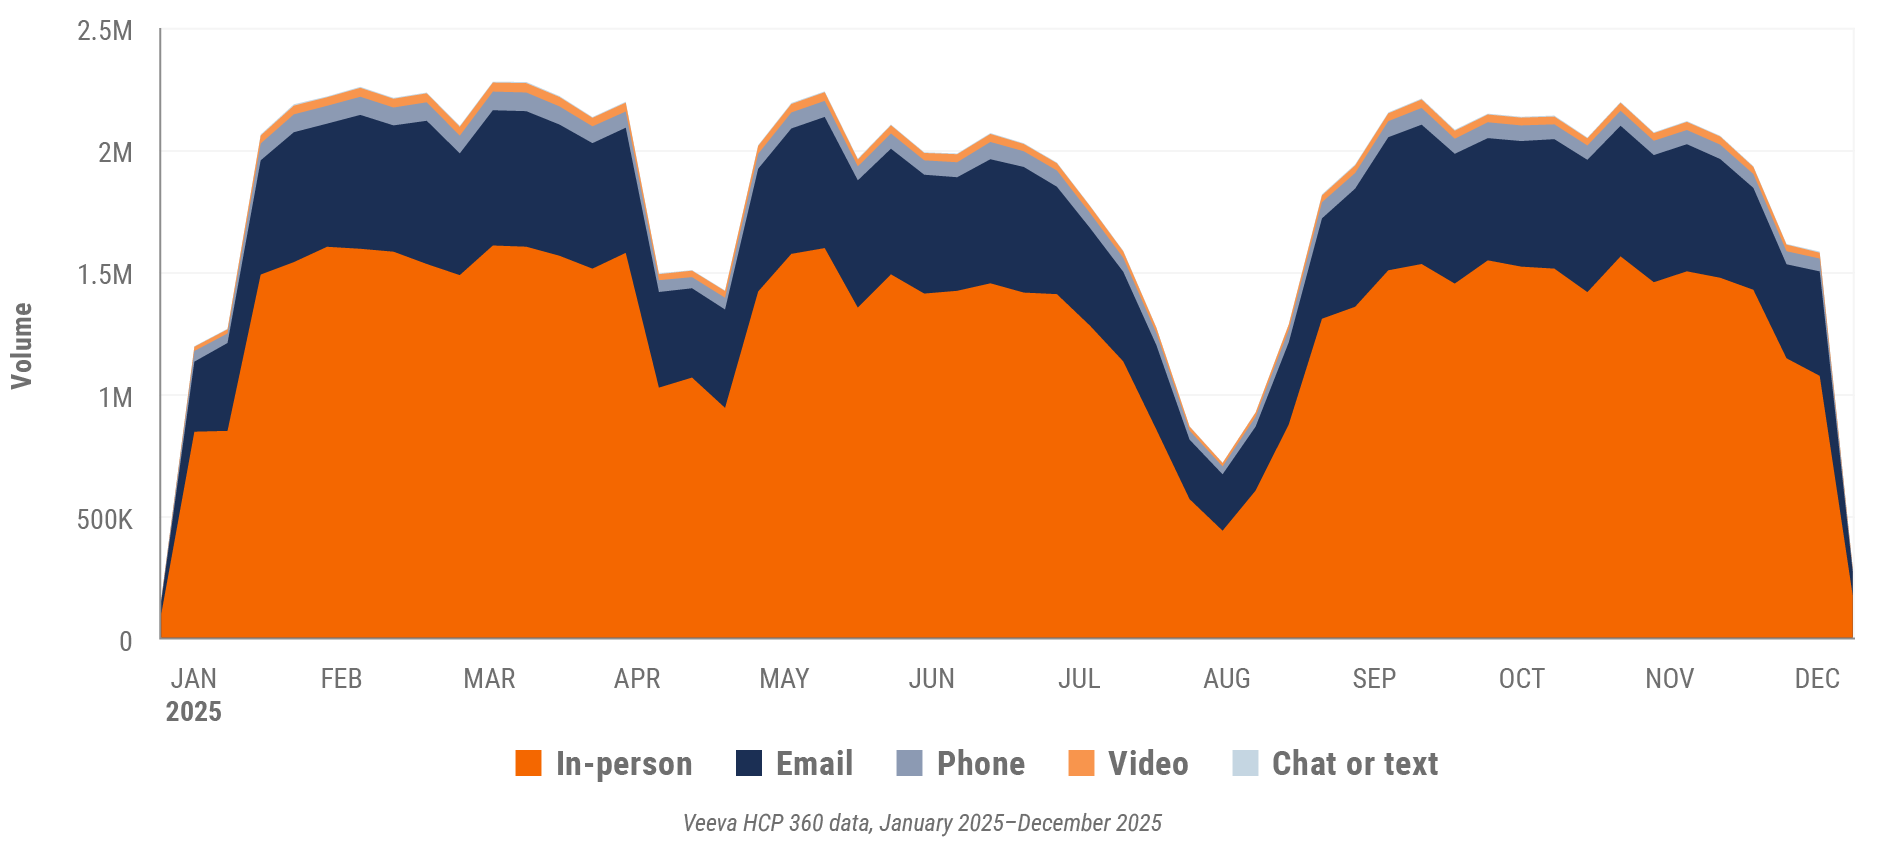
Figure 14: Channel mix, Europe
Europe field team activity Weekly activity per user by engagement channel
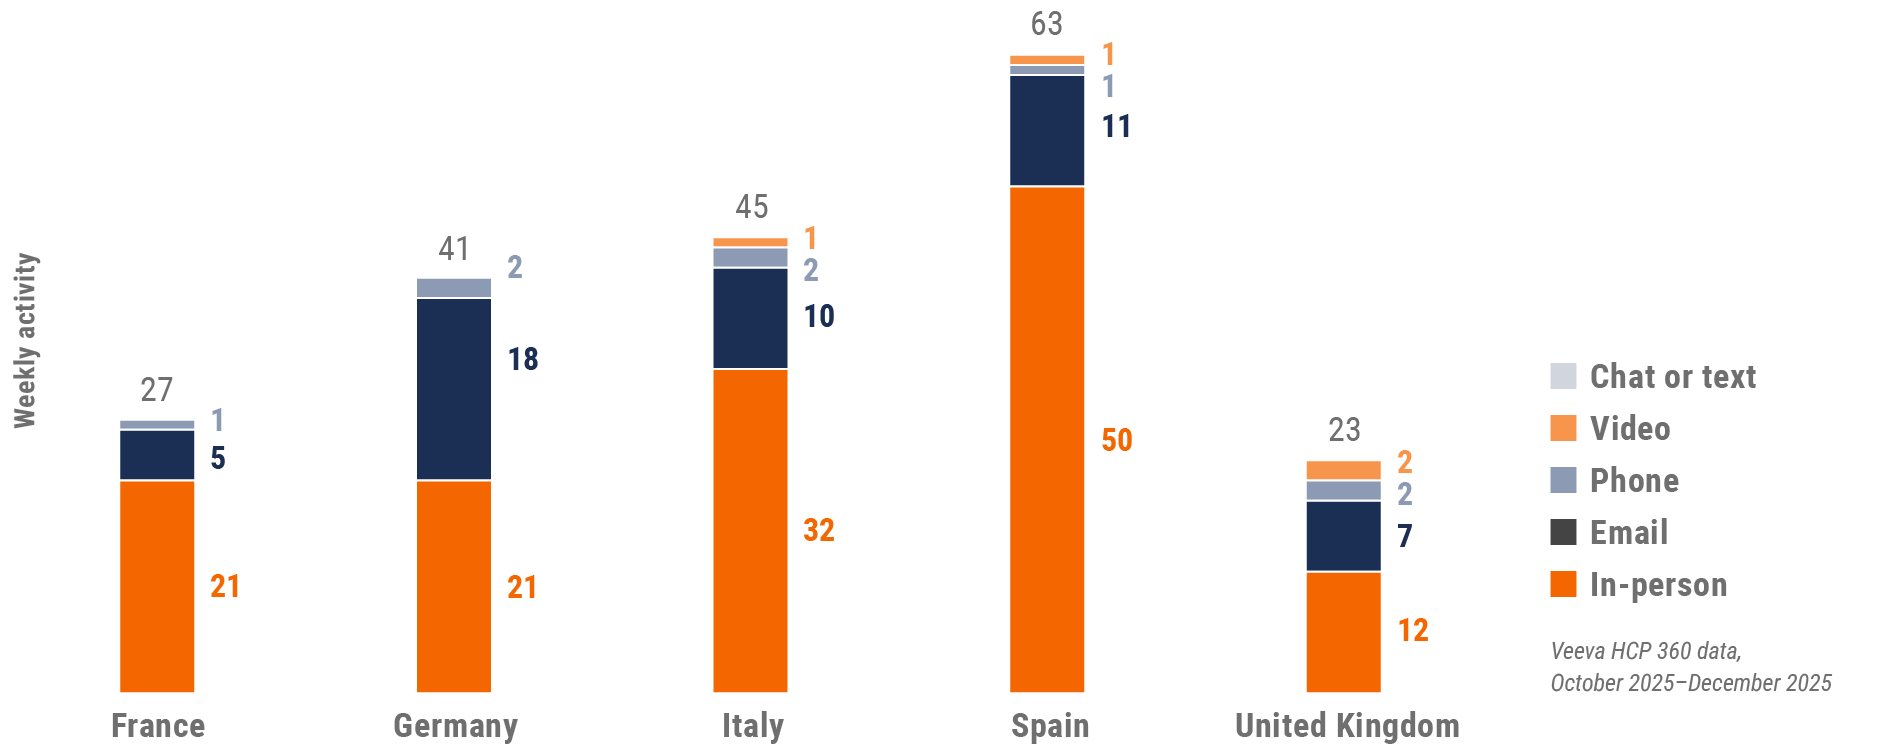
Figure 15: Activity by country, EU5
Europe engagement quality Consolidation of key quality metrics
Figure 16: Approved email volume, Europe
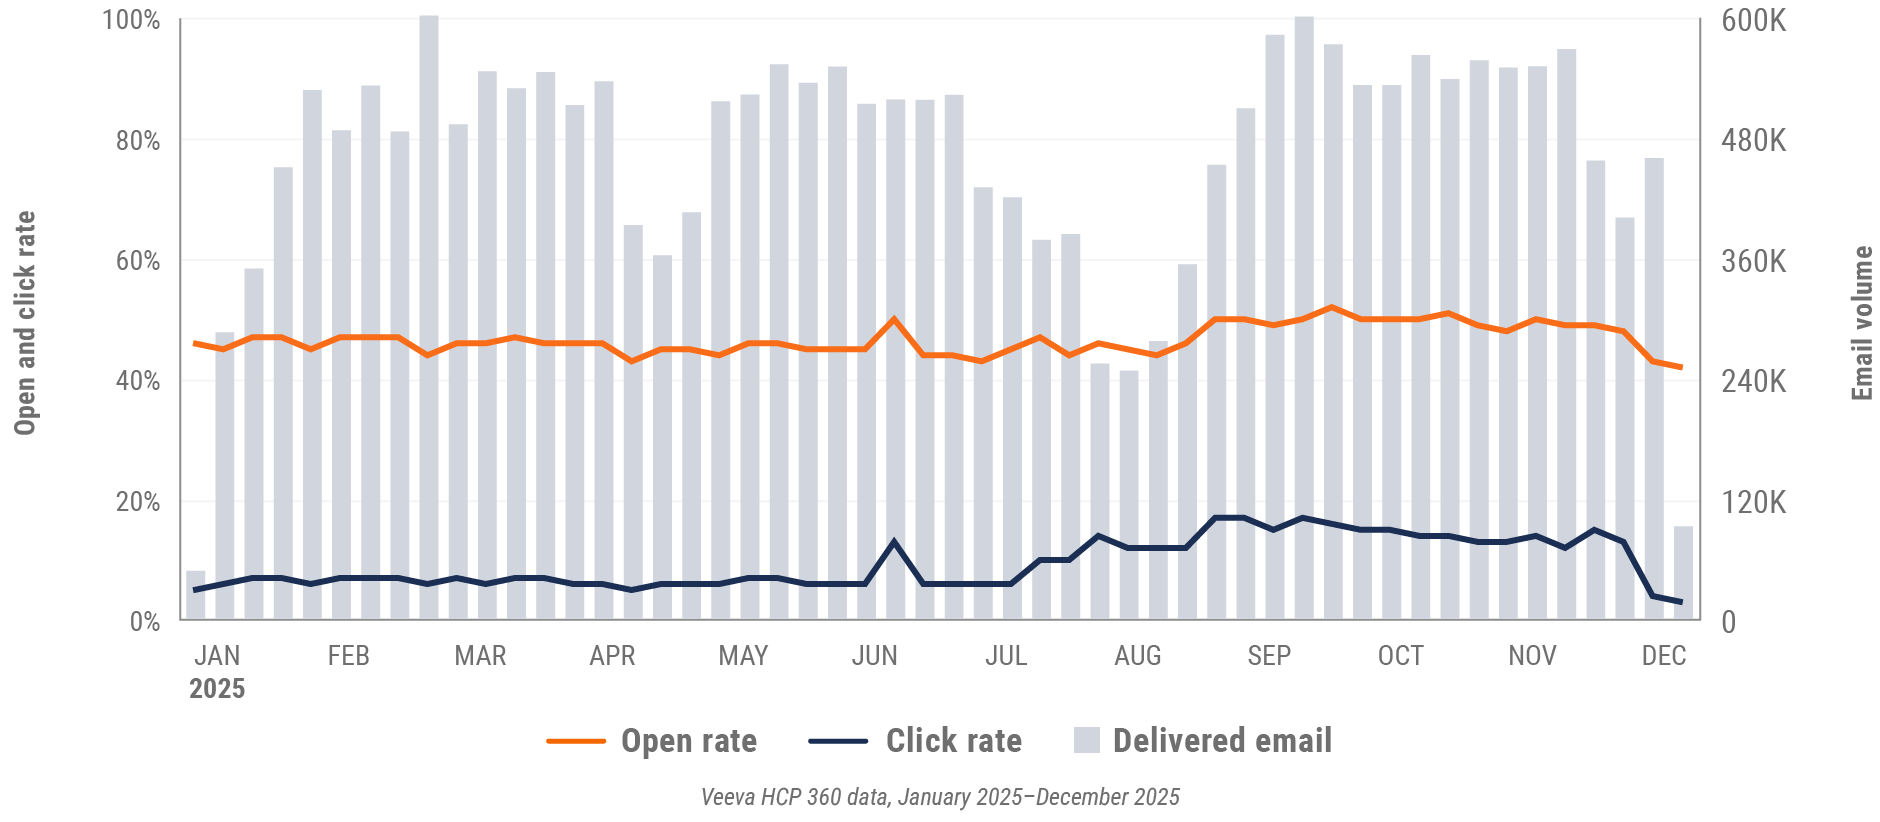
Figure 17: Content usage by channel, Europe
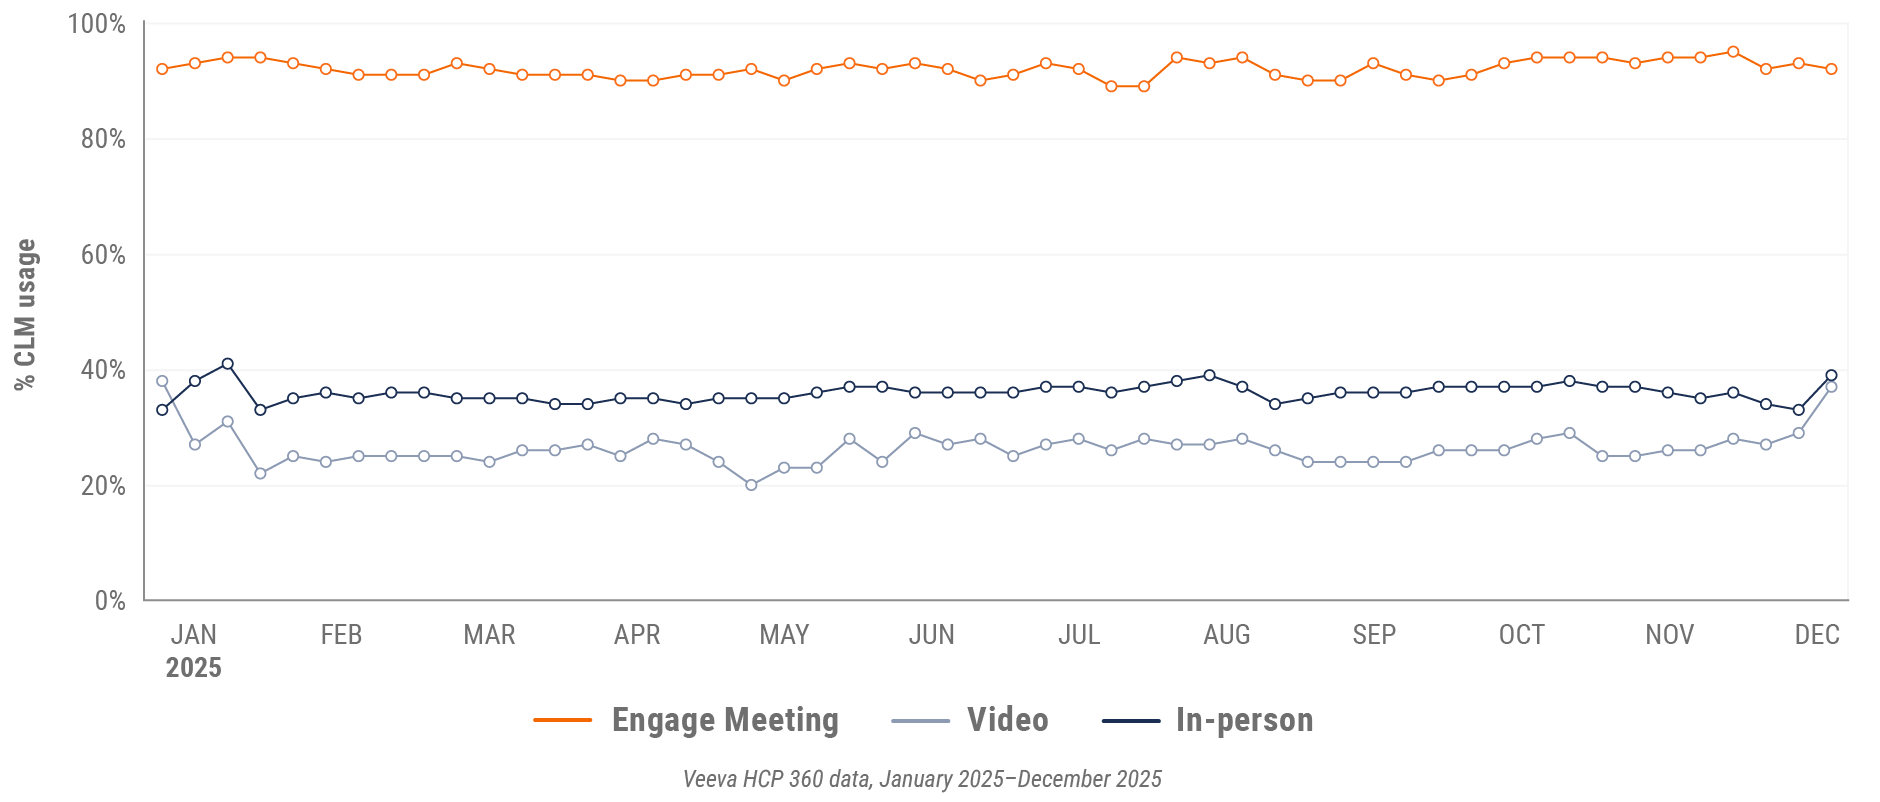
Figure 18: Veeva CRM Engage meeting duration, Europe

Asia market trends
Figure 19: Channel mix evolution, Asia
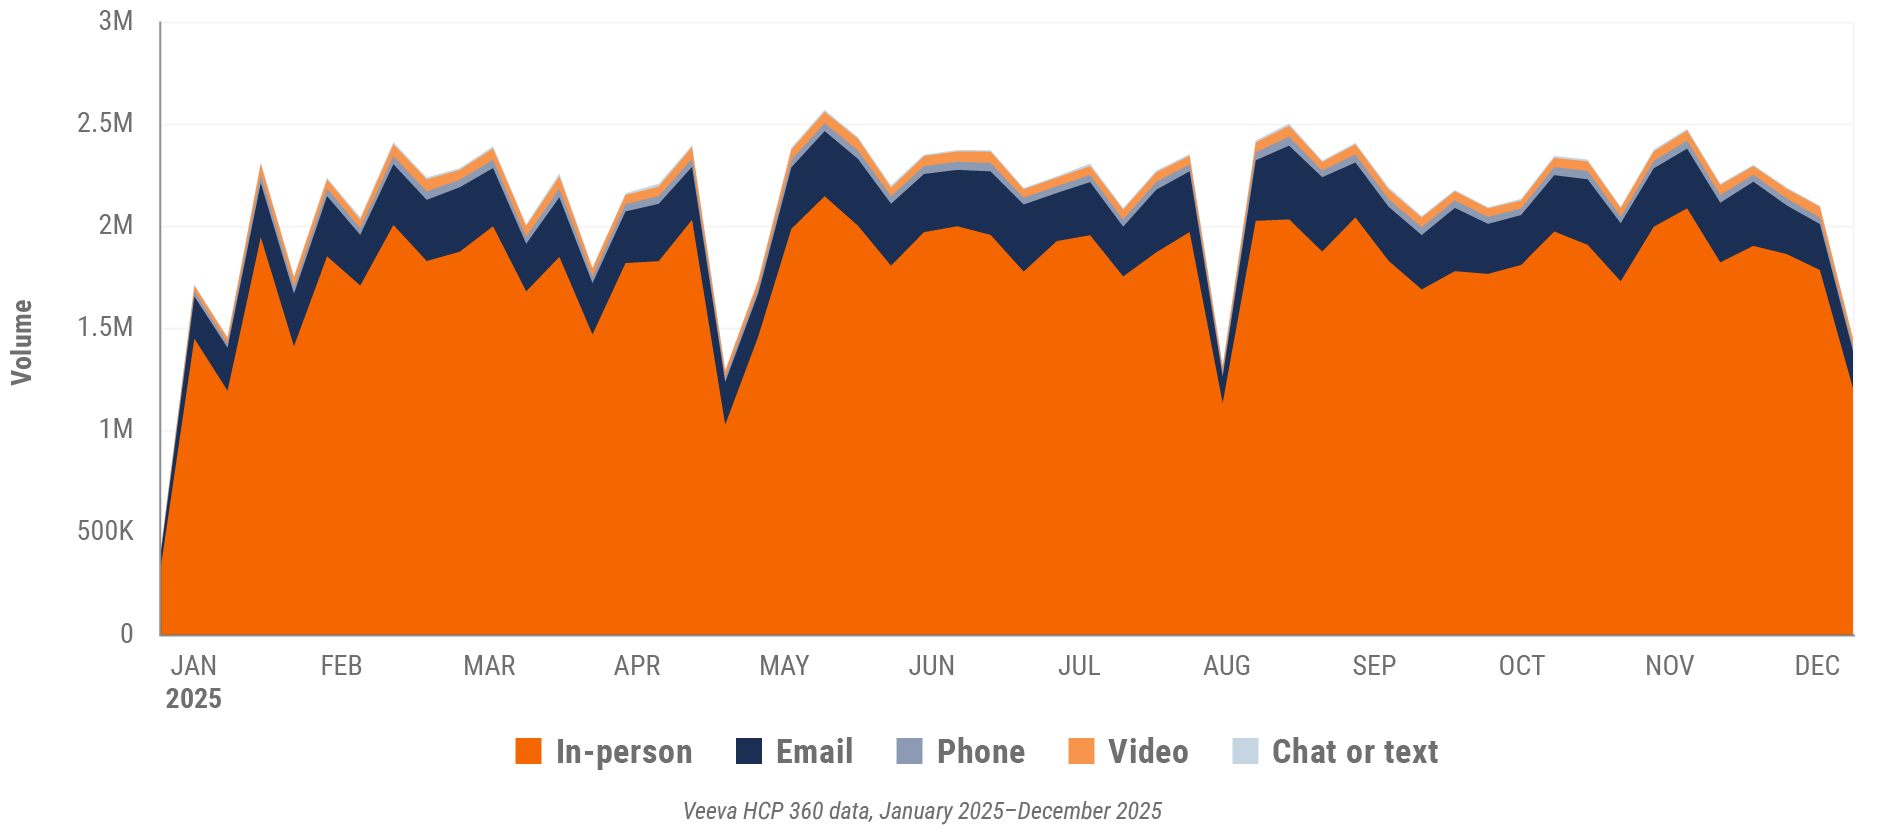
Figure 20: Channel mix, Asia
Asia field team activity Weekly activity per user by engagement channel
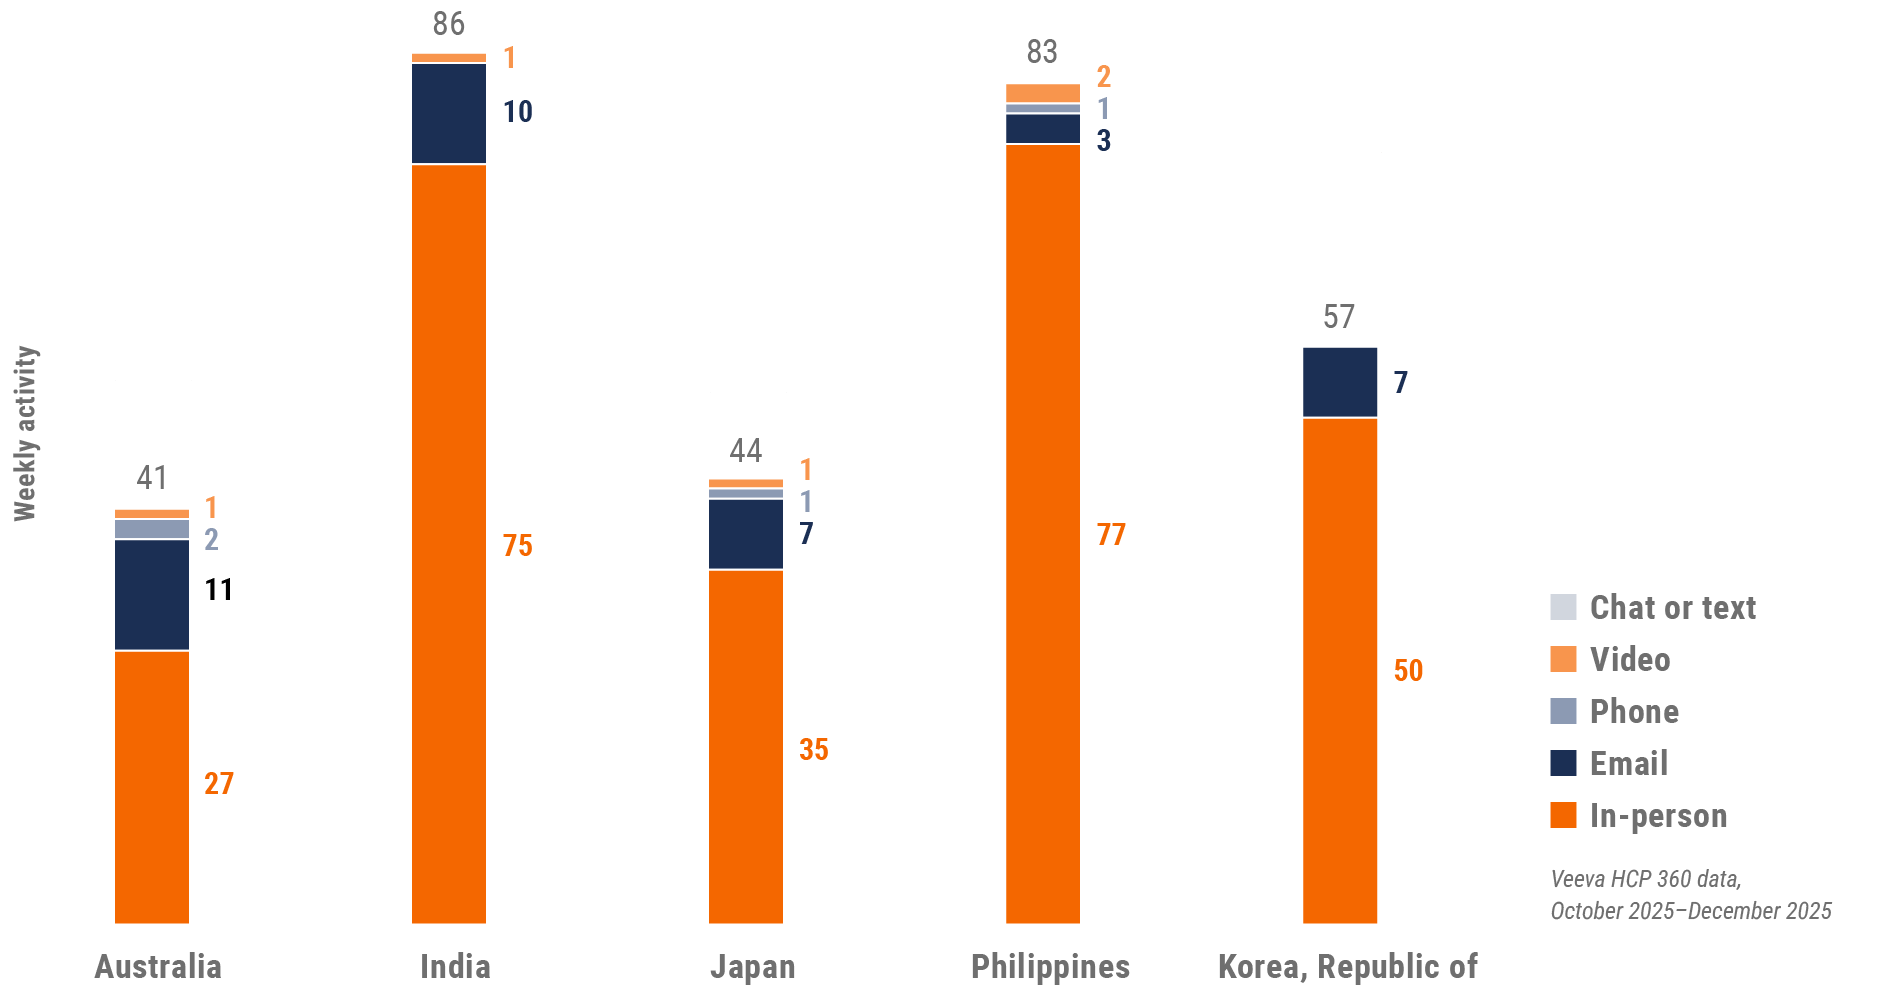
Figure 21: Activity by country, Asia
Asia engagement quality Consolidation of key quality metrics
Figure 22: Approved email volume, Asia
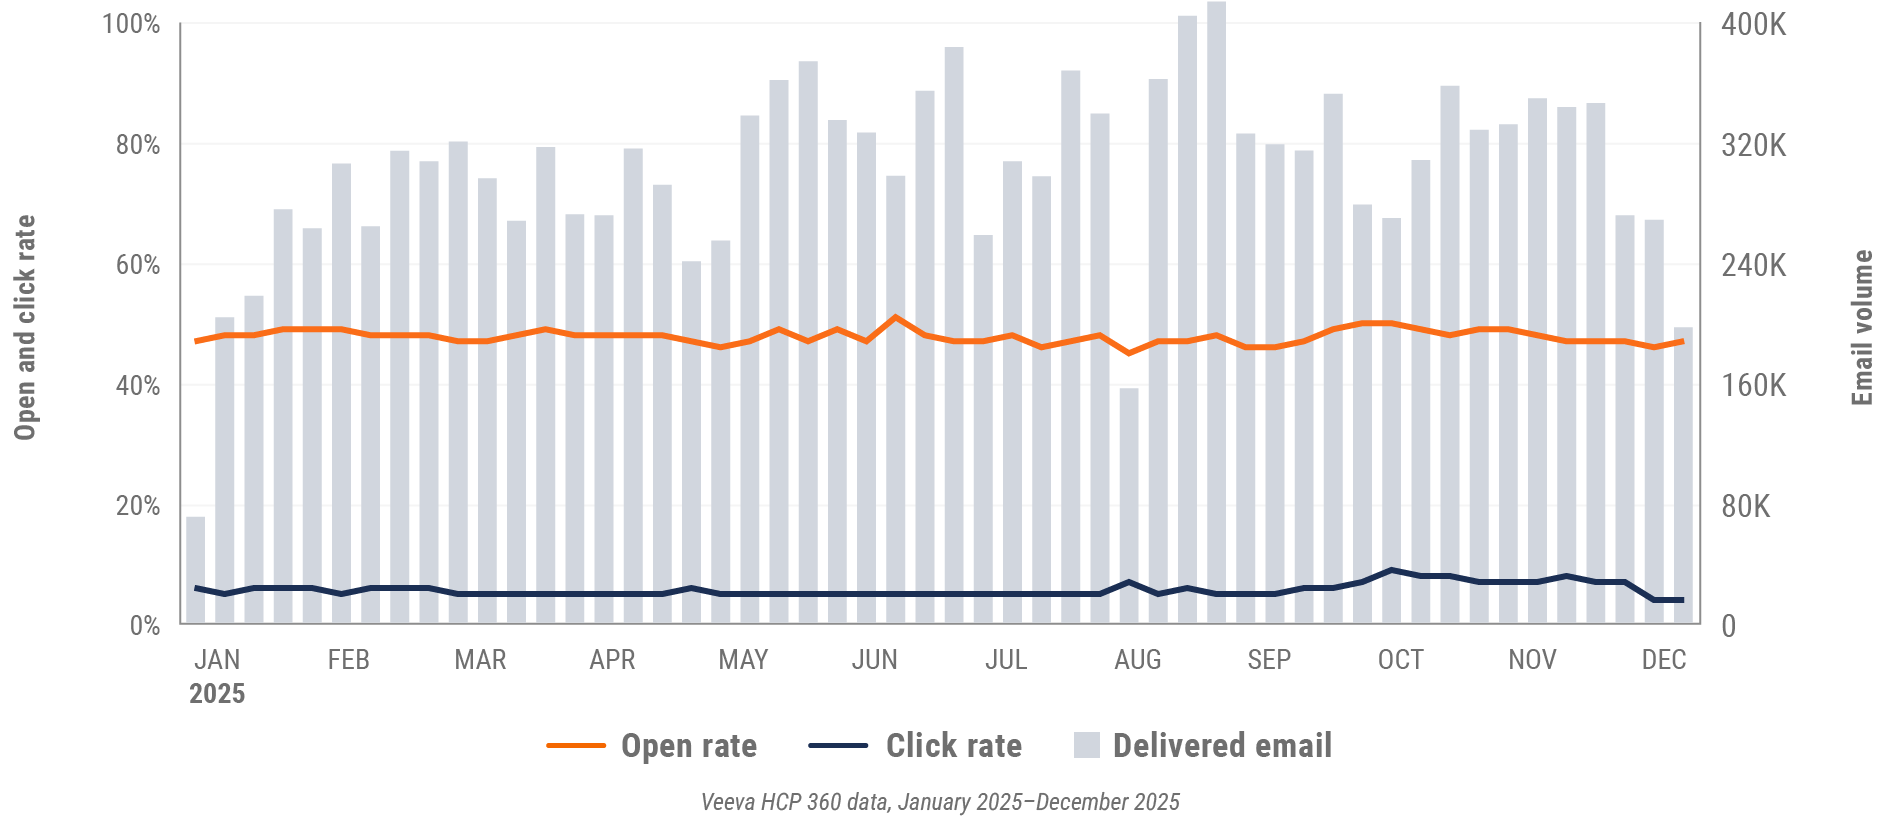
Figure 23: Content usage by channel, Asia
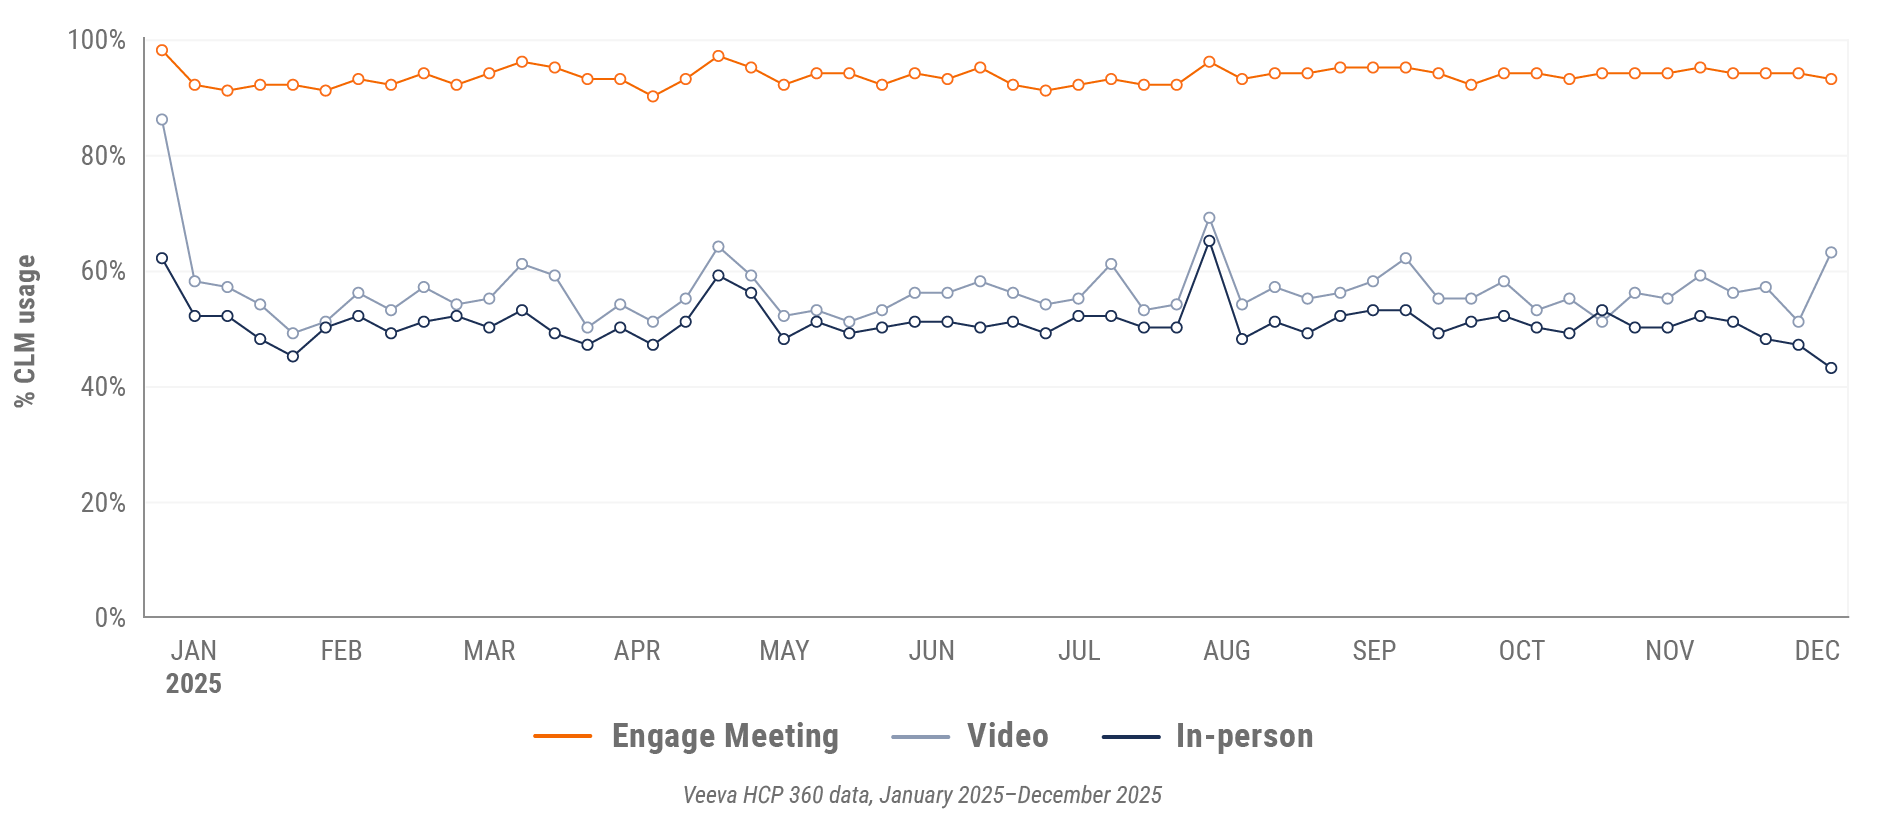
Figure 24: Veeva CRM Engage meeting duration, Asia

Latin America market trends
Figure 25: Channel mix evolution, Latin America
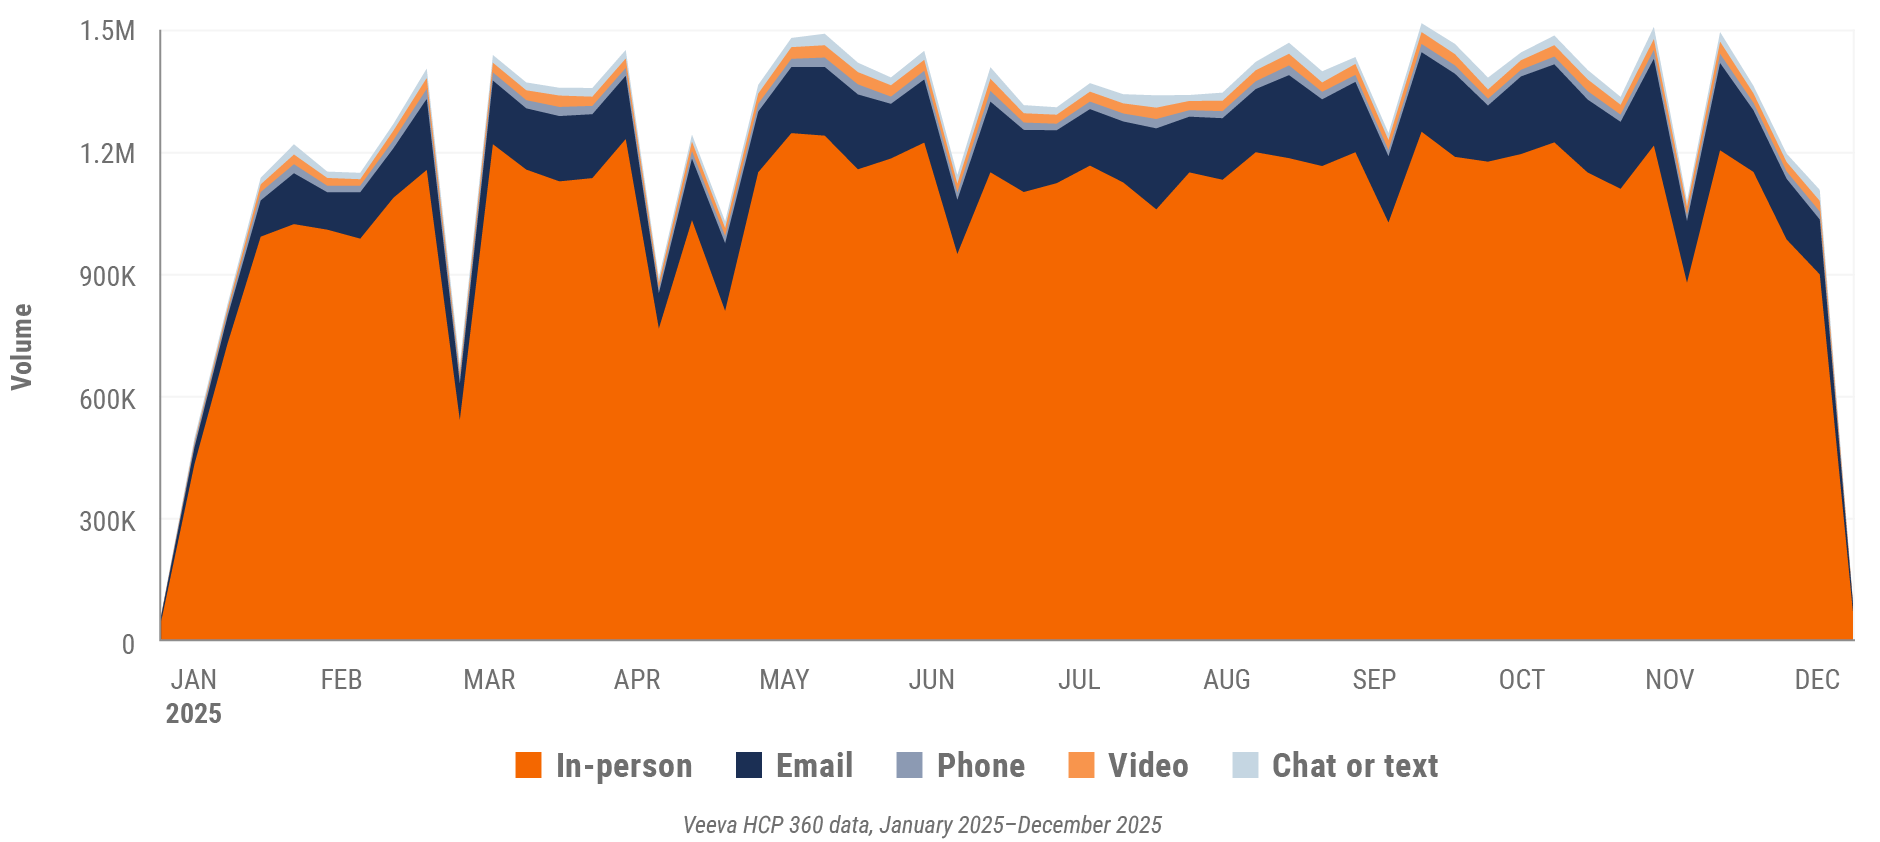
Figure 26: Channel mix, Latin America
Latin America field team activity Weekly activity per user by engagement channel
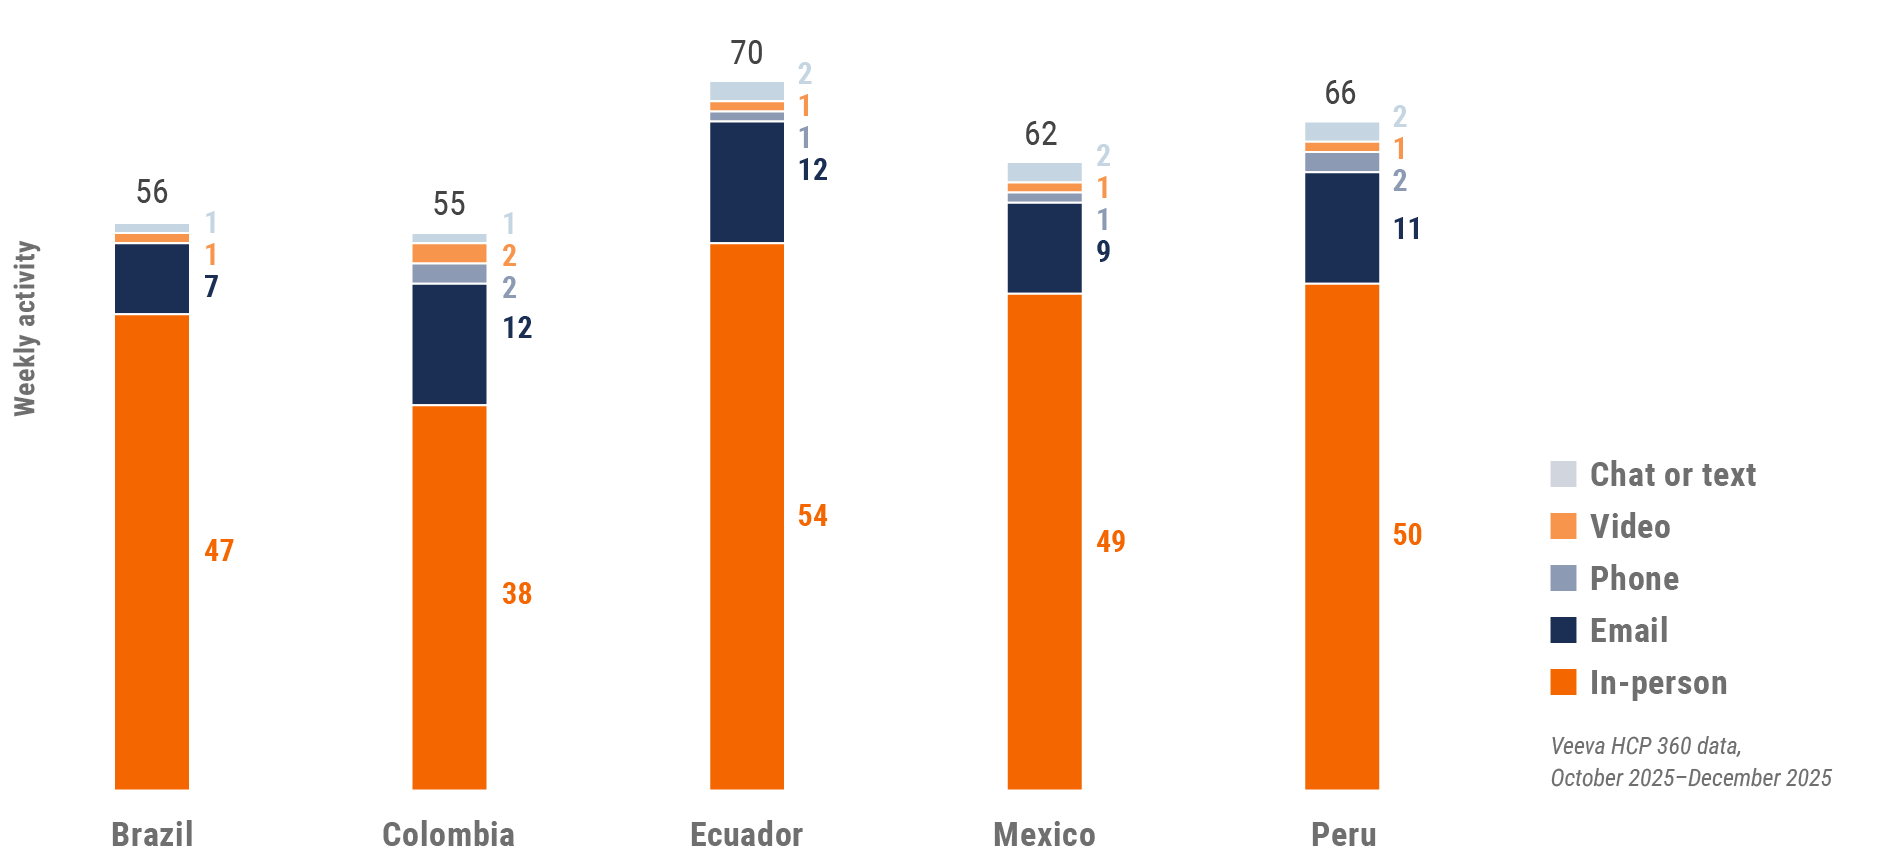
Figure 27: Activity by country, Latin America
Latin America engagement quality Consolidation of key quality metrics
Figure 28: Approved email volume, Latin America
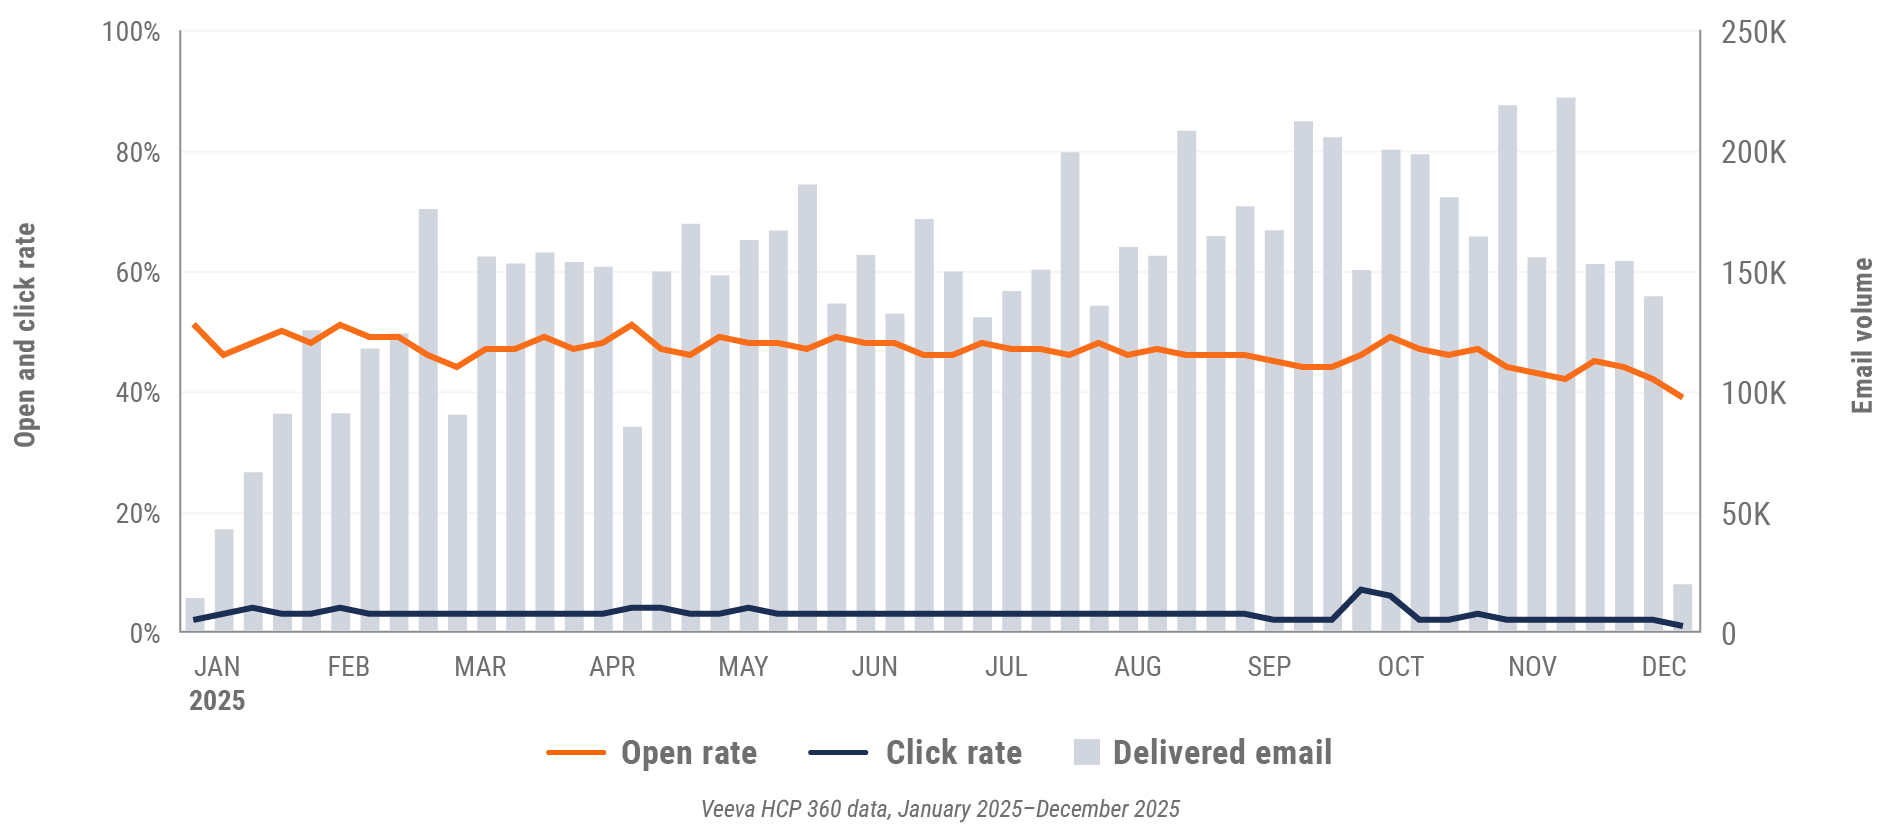
Figure 29: Content usage by channel, Latin America
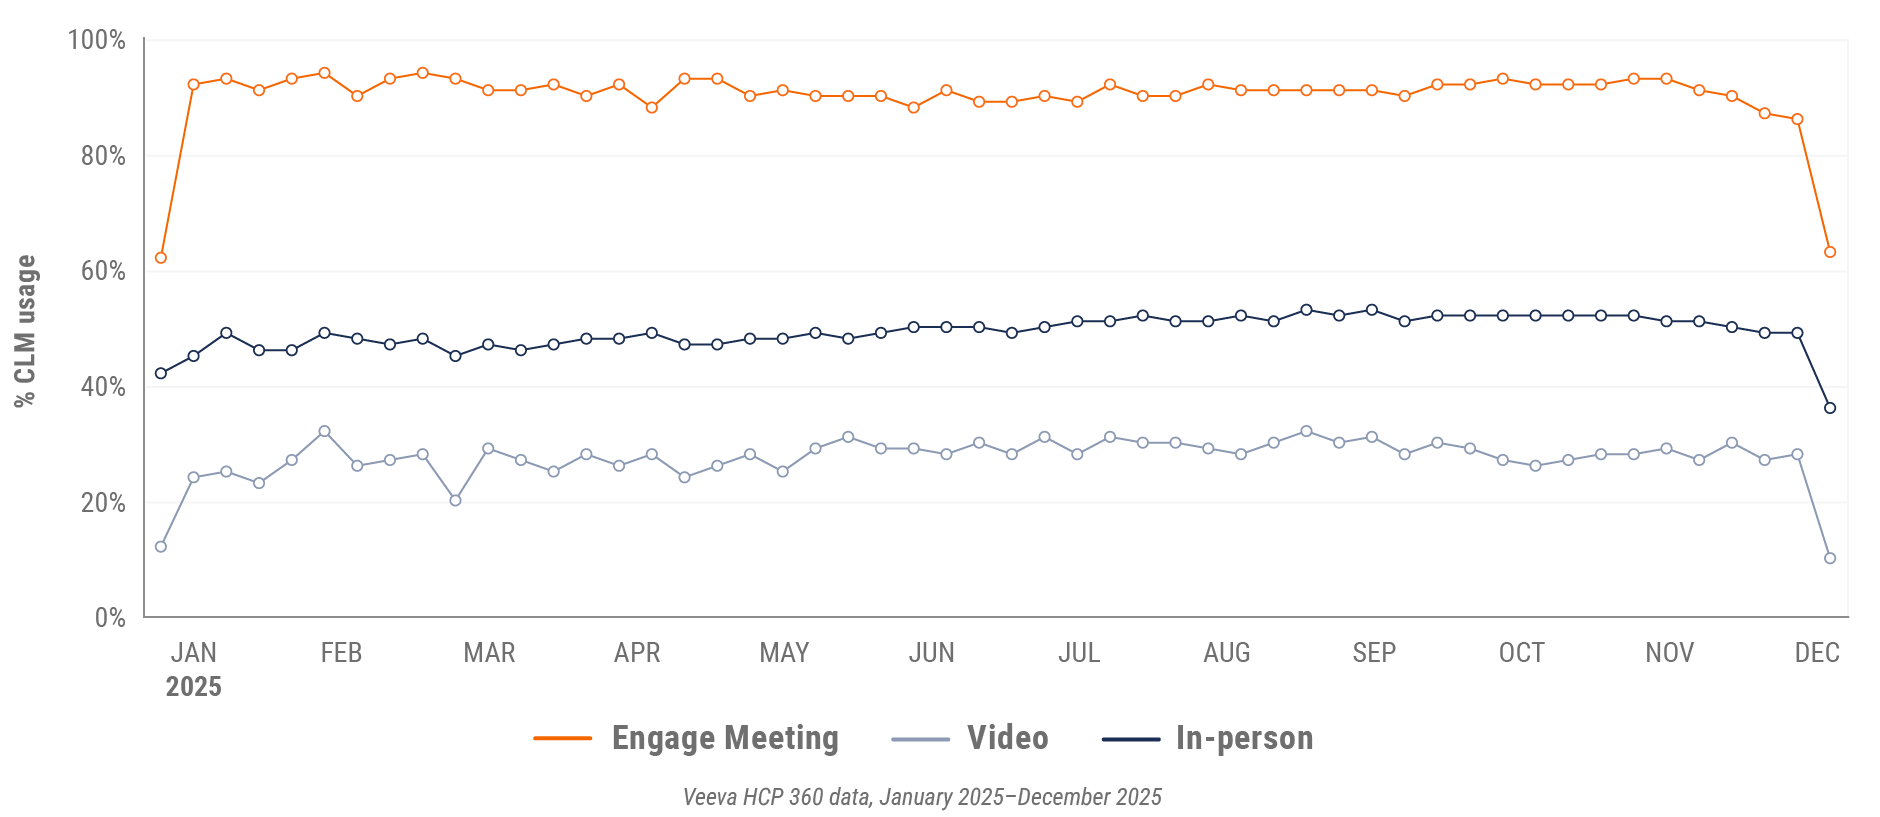
Figure 30: Veeva CRM Engage meeting duration, Latin America

Appendix: Data dictionary
Metric definitions
- Channel mix evolution over time: Weekly Veeva CRM activity volume broken down by the channel of engagement (in-person, phone, video, email, chat or text)
- Channel mix: Total Veeva CRM activity volume broken out by engagement channel percentage, calculated using percent change during the specified period
- Weekly activities per user: The average weekly number of Veeva CRM activities submitted per number of users active in Veeva CRM
- Approved email volume: The average weekly volume of approved emails sent via Veeva CRM, calculated using percent change during the specified period
- Email open rate: Percentage of approved emails opened at least once out of all approved emails sent via Veeva CRM
- Email click rate: Percentage of approved emails clicked at least once out of all approved emails sent via Veeva CRM
- In-person % CLM usage: Percentage of in-person engagements that leveraged content in Veeva CRM
- Video % CLM usage: Percentage of video engagements that leveraged content in Veeva CRM
- Veeva CRM Engage meeting % CLM usage: Percentage of Veeva CRM Engage meetings that leveraged content in Veeva CRM
- Veeva CRM Engage meeting duration: The average duration of Veeva CRM Engage meetings in minutes
Engagement channel definitions
- In-person: Submitted calls with a CRM Standard Metrics call channel value of ‘in-person’
- Phone: Submitted calls with a CRM Standard Metrics call channel value of ‘phone’
- Video: Veeva CRM Engage calls and video calls via other platforms that are then recorded as calls in Veeva CRM with a Standard Metrics call channel value of ‘video’
- Email: Approved emails and emails sent via other platforms that are then recorded as calls in Veeva CRM with a Standard Metrics call channel value of ‘email’
- Chat or text: Submitted calls with a CRM Standard Metrics call channel value of ‘chat or text’
Region definitions
- Global: All markets globally except China
- Europe: Albania, Andorra, Armenia, Aruba, Austria, Azerbaijan, Belarus, Belgium, Bermuda, Bosnia and Herzegovina, Bulgaria, Croatia, Cyprus, Czech Republic, Denmark, Estonia, Finland, France, French Polynesia, Georgia, Germany, Greece, Greenland, Guadeloupe, Guernsey, Hungary, Ireland, Italy, Jersey, Latvia, Lithuania, Luxembourg, Macedonia, Malta, Martinique, Republic of Moldova, Monaco, Montenegro, Netherlands, New Caledonia, Norway, Poland, Portugal, Romania, Serbia, Slovakia, Slovenia, Spain, Sweden, Switzerland, Ukraine, United Kingdom
- Asia: Australia, Bangladesh, Bhutan, Brunei Darussalam, Cambodia, Cocos (Keeling) Islands, Indonesia, Japan, Kazakhstan, Republic of Korea, Kyrgyzstan, Malaysia, Mongolia, Myanmar, Nauru, Nepal, New Zealand, Philippines, Samoa, Singapore, Solomon Islands, Sri Lanka, Taiwan, Tajikistan, Thailand, Turkmenistan, Uzbekistan, Vietnam
- Latin America: Antigua and Barbuda, Argentina, Bahamas, Barbados, Belize, Bolivia, Brazil, Chile, Colombia, Costa Rica, Cuba, Dominican Republic, Ecuador, El Salvador, Guatemala, Guyana, Haiti, Honduras, Jamaica, Mexico, Nicaragua, Panama, Paraguay, Peru, Trinidad and Tobago, Uruguay, Venezuela
Methodology
The Veeva HCP 360 Trends Report is a quarterly industry benchmark for global and regional healthcare professional (HCP) engagement across the life sciences industry. The findings are based on:
- Approximately 600 million annual global field activities captured in Veeva CRM and Veeva CRM Engage.
- Marketing effectiveness data from Veeva Crossix. Crossix connects anonymized health data on 300+ million patients to media data to measure the impact of direct-to-consumer and HCP marketing investments in the U.S.
- Anonymous patient longitudinal claims data from Veeva Compass Patient covering dispensed prescriptions, procedures, and diagnoses from 300+ million patients.
- 4+ million profiles containing publications, clinical trials, conferences, associations, guidelines, grants, payments, social media, news mentions, and patient mix by disease and drug class from Veeva Link Key People in 85+ countries and all major therapeutic areas.
- Global reference data of HCPs, healthcare organizations, and affiliations from Veeva OpenData, containing addresses, emails, specialties, demographics, and compliance data (license information and industry identifiers) in 100+ countries.
The Veeva HCP 360 Trends Report delivers insights that inform the industry and help field teams align their strategy to key market trends for improved commercial success. The global Veeva Business Consulting team also helps customers inform their strategies using industry benchmarking with Veeva HCP 360 data.