Industry Report
Veeva Pulse Field Trends Report Q3 2022
HCP access rebounds to 60%, but not for everyone.
NOVEMBER 2022
HCP Access Rebounds to 60%, But Not for Everyone
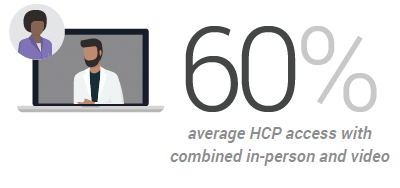
Sixty percent. That’s the average percentage of accessible healthcare professionals (HCPs) in the U.S. across top specialties. Does that number surprise you?
Informed by anecdotal and limited data, there’s a common belief that HCP access is much lower and hasn’t returned to pre-pandemic levels.
Now with Veeva Pulse—the largest-ever analysis of 600 million annual HCP-rep interactions globally across more than 80% of the industry—we have the full picture: HCP access is back, and more virtual. However, it’s more selective than ever. And with the rapidly changing channel mix, field effectiveness also varies even more widely among companies.
Although access is not the same for everyone, there are clear steps companies can take to be more successful. Field teams must understand which HCPs are genuinely accessible, and which HCPs are selectively engaging with other companies. And, they must allocate their valuable—yet limited—field resources accordingly, including rethinking targeting and channel mix to achieve the right reach.
Read on for our in-depth analysis of HCP access and recommended actions, and reach out to Veeva Business Consulting to find out how we can help you use this industry data to help measure your access relative to the industry, improve your field execution, and achieve our shared vision for commercial excellence.
Thank you,

Dan Rizzo
Vice President, Business Consulting, Veeva
PULSEINSIGHT
Access is back and includes video for 50% of accessible HCPs
In this report, HCP access is defined as an HCP’s willingness to meet with reps, either in-person or via video.
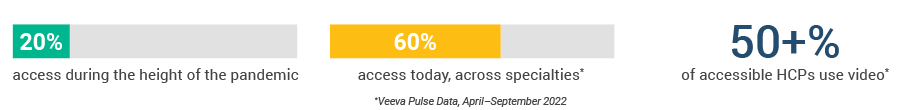
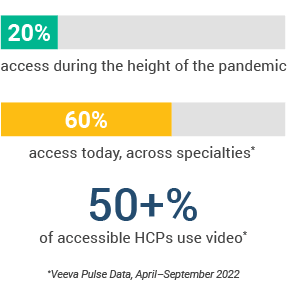
Historically, HCP access has largely been measured by in-person meetings. But, even before the pandemic pushed HCP access to an all-time low of roughly 20%, historical estimates have shown a significant decline for more than a decade. Now, HCP access is back—and perhaps even better than some pre-pandemic estimates—but in a different way.
Veeva Pulse data show that HCP access has rebounded to 60% across specialties. A closer look reveals that this engagement is increasingly virtual: of those accessible HCPs, more than 50% meet with reps via a hybrid mix of in-person and video channels.
Figure 1 I HCP Access Trends
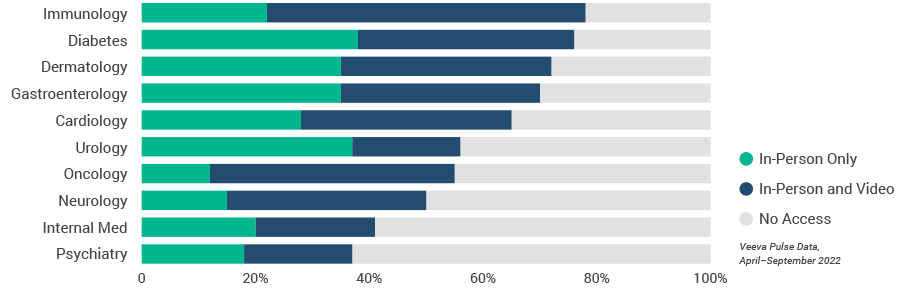
There is also significant variation in access and channel usage by specialty (Figure 2). The specialties with the lowest access are psychiatry, internal medicine, and neurology. In contrast, the highest access levels are in immunology, diabetes, and dermatology. Interestingly, 78% of accessible oncologists engage via a mix of in-person and video vs. in-person alone, a wider gap than any other specialty.
This data shows that in-person meetings are no longer the sole indicator of HCP access. Investments made in omnichannel capabilities like video continue to yield results and can be a powerful differentiator in combination with in-person tactics.
Figure 2 I U.S. HCP Access by Specialty and Channel
KEYTAKEAWAY
Reevaluate how you measure HCP access beyond your own field organization and ensure you’re using video to help expand your access.
PULSEINSIGHT
Video expands access and improves promotional response
3x
promotional response from video when added between in-person.Companies with the highest level of access to HCPs leverage video as an additive channel, according to key findings from the previous Veeva Pulse Field Trends Report. In addition, the report showed video has a three times greater promotional response when added between in-person meetings.
2.5x
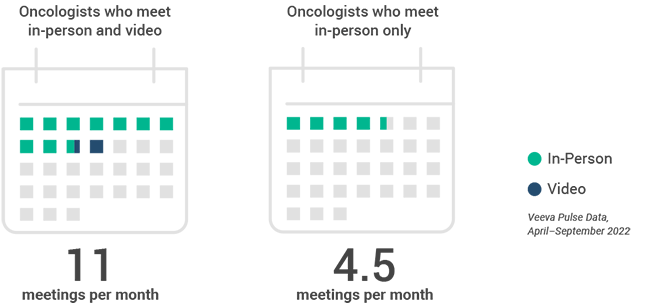
increase in oncologist meetings with combined in-person and videoInterestingly, video is also connected to increased in-person meeting frequency. For example, oncologists who meet with reps in-person only average 4.5 meetings per month, while oncologists who engage via a mix of in-person and video average 11 meetings per month, including double the amount of in-person touch points (Figure 3).
Figure 3 I In-Person and Video Meetings vs. In-Person Meetings Alone in Oncology
KEYTAKEAWAY
Educate your field on the impact video can have on accelerating sales, build it into your call plans, and use video as an additive channel to in-person.
PULSEINSIGHT
Most accessible HCPs only meet with select companies
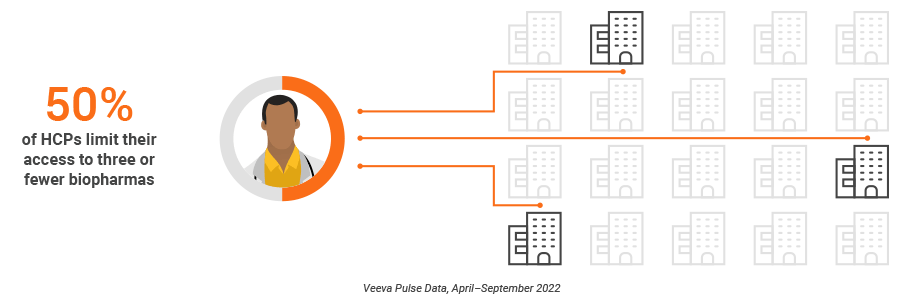
Although access is better than most companies think, there’s a catch: access is not the same for everybody. Fifty percent of accessible HCPs are highly selective and limit their access to three or fewer biopharmas (Figure 4), and that access can vary greatly by specialty.
Figure 4 I Not All Access is Created Equal
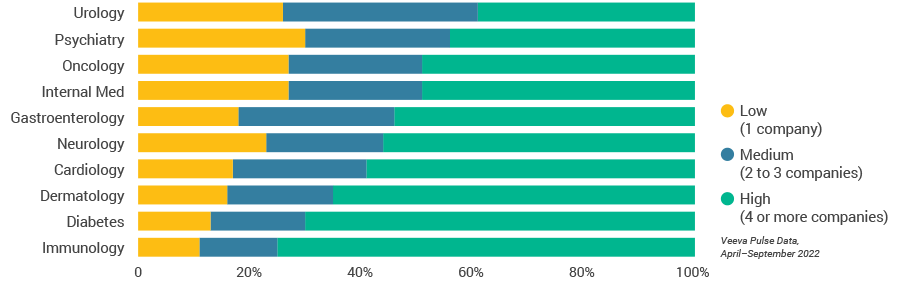
Urology, psychiatry, internal medicine, and oncology are the most selective specialties. For example, most oncologists meet with three or fewer companies, and 30% of psychiatrists limit access to just one company (Figure 5). On the other hand, immunology, diabetes, and dermatology are the least selective. More than 70% of immunologists are accessible to four or more companies.
It is imperative for field teams to understand the true nature of target HCP access. Are they open to everyone, no one, or just a select few companies?
Figure 5 I U.S. HCP Selectivity, 30-Day Average
KEYTAKEAWAY
Understand if target HCPs are truly inaccessible vs. limiting their access to a select few.
PULSEINSIGHT
Some companies are more effective—and efficient—at reaching HCPs
In this report, HCP reach is defined as a company’s ability to engage an accessible HCP either in-person or via video.
In addition to disparities in access, wide gaps in HCP reach exist between companies as well. Companies with the strongest reach have on average three times the reach of their peers (Figure 6a) and, in some areas, the differences are even more drastic. For example, in diabetes, the company with the highest reach engages 63% of total HCPs vs. the weighted average of 11%. That means there’s a wide gap between leading companies and the rest of the pack.
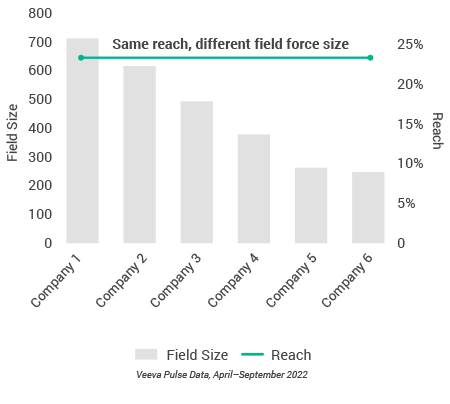
The data also demonstrates that some field forces are more efficient than others. For example, in the oncology space (Figure 6b), six companies with approximately the same reach had significantly different field sizes, ranging from more than 700 reps on the high end, to roughly 250 on the low end. This suggests that the ‘more boots on the ground’ approach is not the sole solution to improving reach.
Figure 6a I U.S. Access and Reach by Specialty
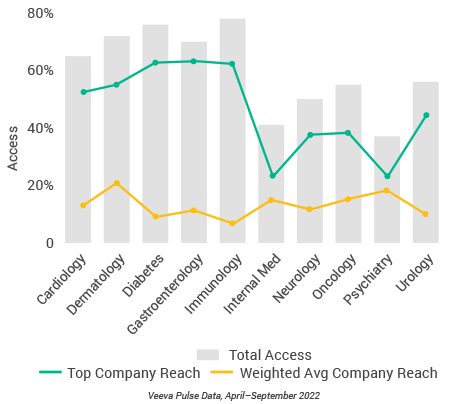
Figure 6b I Reach vs. Oncology Field Force Size
KEYTAKEAWAY
In addition to evaluating your access relative to your peers, benchmark field productivity to gauge efficiency levels.
PULSEINSIGHT
Digitally-enabled reps use content, time with HCPs more effectively
Getting access to the HCP is the first step. But how you use that time with the HCP is equally important. Our last report demonstrated how promotional success is driven by time with the customer and the effective use of content. Time with the customer through a blend of in-person and video channels signals trust. Content use signals effective and clear communication. Engagement through all other channels—e.g., email, phone, chat—are secondary support for digitally enabled reps who optimize for facetime with the customer.
"The last few years have pushed us to reevaluate our field force strategy and find better ways of maintaining successful HCP relationships. Veeva Pulse proves that digitally-enabled reps create a better experience for customers, are more efficient in educating prescribers, and are better connected to our overall brand strategy through cross-channel engagement." Kate Greengrove, Head of Commercial Operations, GlaxoSmithKline
But not all companies are using their reach the same way. In an analysis of oncology, Veeva Pulse and Veeva Compass data shows that the most commercially successful field teams use their access more effectively than lagging companies, even when normalized for field force size and reach. What is it that makes these teams more effective?
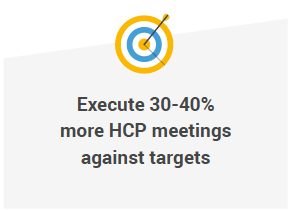
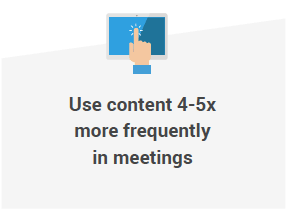
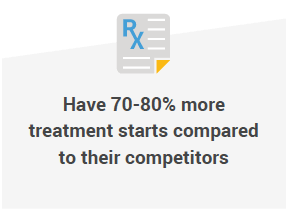
The data show that these field teams:
Veeva Pulse and Compass, April 2022 - September 2022, companies with with similar field force size and reach
KEYTAKEAWAY
Maximize field productivity planning, reinforce the importance of content usage, and use video to help increase meetings between in-person discussions.
Three keys to improving field effectiveness
As you use this data to plan your field force strategy and execution, stay focused on these three key takeaways:
- Access is back, but in a different way. HCP access is now averaging 60% driven by in-person and video. Veeva Pulse data gives the industry a reliable source to understand how HCPs are engaging across this channel mix.
- Access is more virtual and selective. Determine if target HCPs are truly inaccessible vs. limiting their access and compare HCP access to field force reach to reveal efficiency gaps and broaden channel strategies.
- Field force effectiveness varies greatly by company. Engage HCPs more effectively via a mix of in-person and video as well as sharing content more frequently to drive new treatment starts.
For more insights on how to use Veeva Pulse data to benchmark your field effectiveness, reach out to us at businessconsulting@veeva.com.
Global and Regional Views
This section highlights global and regional engagement trends from Veeva Pulse data between April to September 2022. Veeva Pulse data is sourced from Veeva’s aggregated CRM activity dataset, inclusive of field engagement stats from all instances of Veeva CRM globally.
Global trends
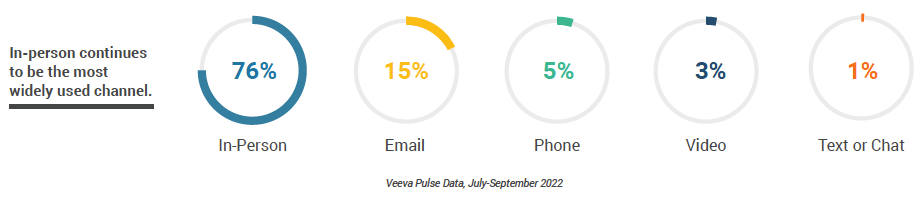
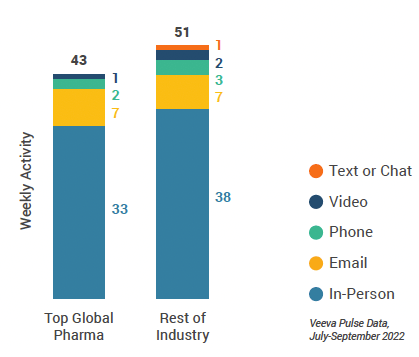
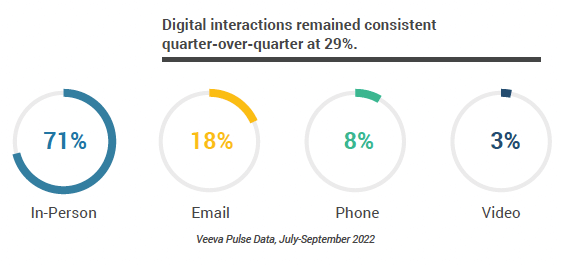
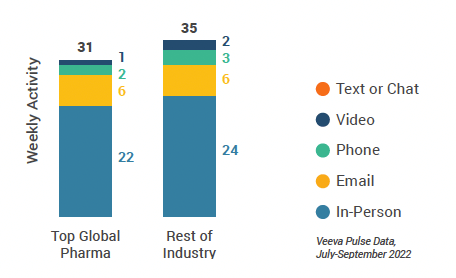
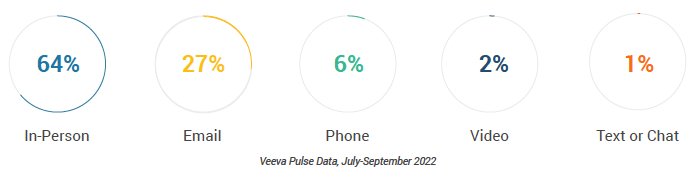
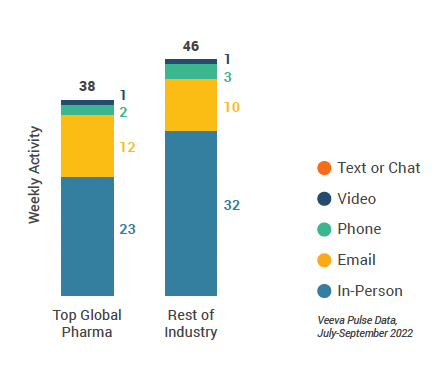
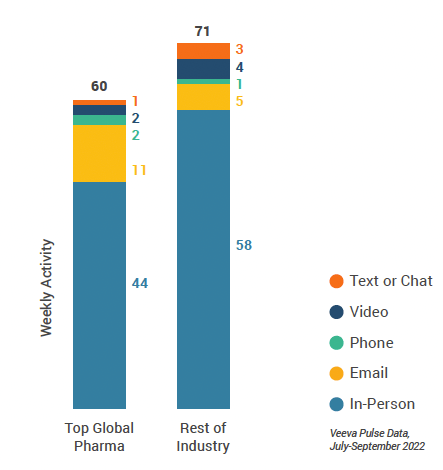
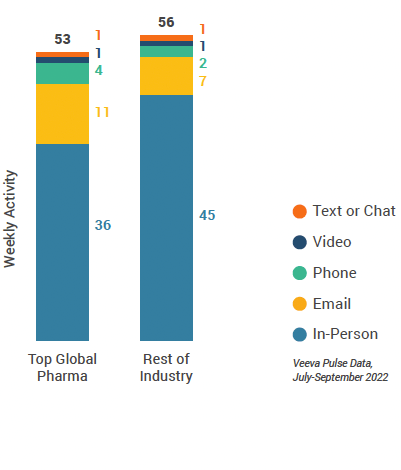
- Total activity across engagement channels decreased during July and August (Figure 7). In-person continues to be the most widely used channel (Figure 8), at 76% versus 15% email, 5% phone, 3% video, and 1% chat or text. In-person HCP engagement increased slightly quarter-to-quarter, from 73% to 76%, despite the slight decrease in total activity.
- The proportion of email activity decreased from 18% to 15%, as indicated by a decline in Veeva CRM Approved Email volume (Figure 12).
- This quarter, content usage rates were on the rise. Content usage via Veeva CRM Engage remained consistently high at 85%, while content utilization through other video platforms increased by 10% and 5% via in-person (Figure 13).
- Clear differences remain in the level and type of engagement between user types. As expected, sales reps had the highest productivity, but key account managers (KAMs) were most active via phone (three calls per user per week). Despite recording the lowest volume of activity, medical users had the highest proportion of video channel activity, with two calls per user per week (Figure 10).
- Differences also exist when comparing regional channel preferences. Most HCP interactions (91%) in China were in person, much greater than in any other major region (Figure 9). The Asia Pacific region had the most video calls (three per user per week) compared to only one per user per week in all other regions.
Figure 7 I Channel Mix Evolution
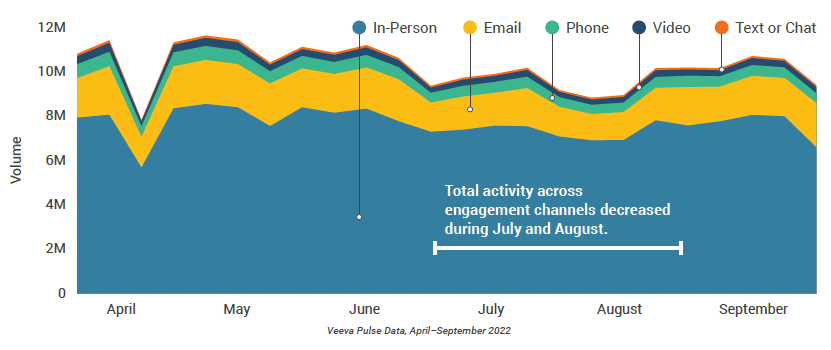
Figure 8 I Channel Mix
Global Field Team Activity
Weekly Activity Per User by Engagement ChannelFigure 9 I Activity by Region
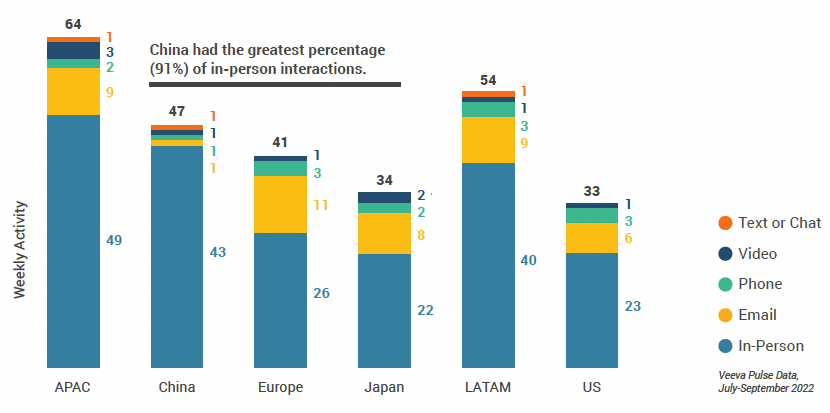
Figure 10 I Activity by User Type
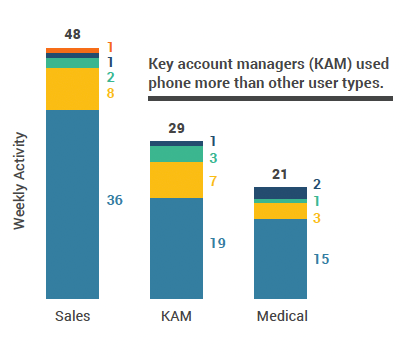
Figure 11 I Activity by Company Size
Global Field Team Activity
Weekly Activity Per User by Engagement ChannelFigure 12 I Approved Email Volume
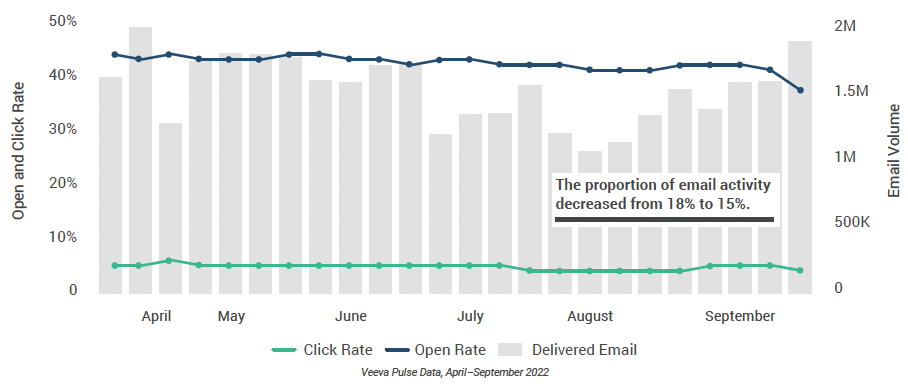
Figure 13 I Content Usage by Channel
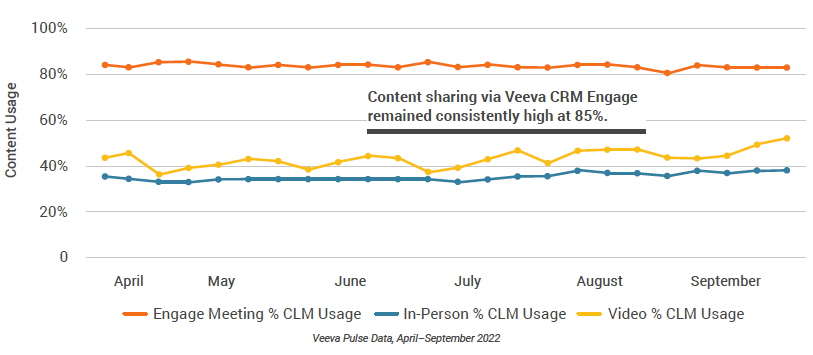
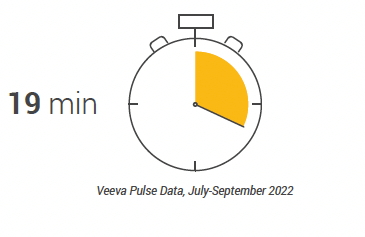
Figure 14 I Engage Meeting Duration
U.S. market trends
- The U.S. remained the most unchanged region since the last report, with a consistent channel mix (Figure 16).
- The proportion of digital interactions (email, phone, and video engagement) remained consistent since last quarter at 29% (Figure 16). Adoption of chat or text calls in the U.S. remained lower than in other regions, accounting for just 0.03% (Figure 16) or approximately 500 touchpoints weekly, versus approximately 20,000 in Asia Pacific, and 6,500 in Europe, even amid its seasonal slowdown.
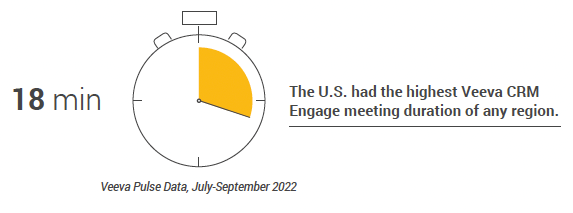
- Content utilization in Veeva Engage meetings remained at 80% (Figure 21), while the average Veeva CRM Engage meeting duration in the U.S. remained the highest of any region at 18 minutes.
- Despite maintaining the volume of email delivered via Veeva CRM Approved Email, open rates declined by 2% since June, ending the quarter at 28%, and click rates decreased by 1% (Figure 20).
Figure 15 I Channel Mix Evolution, U.S.
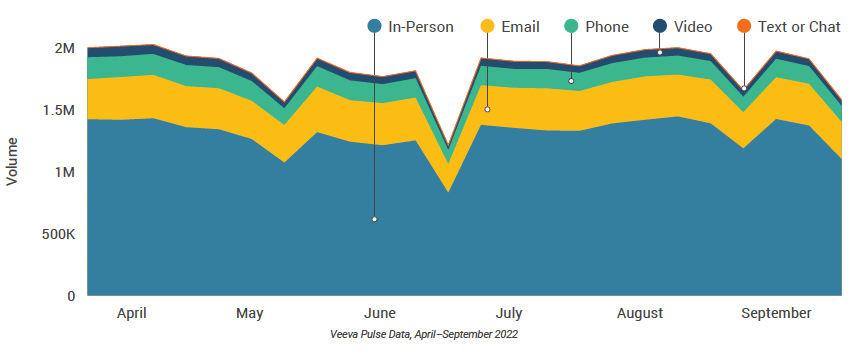
Figure 16 I Channel Mix, U.S.
U.S. Field Team Activity
Weekly Activity Per User by Engagement ChannelFigure 17 I Activity, U.S.
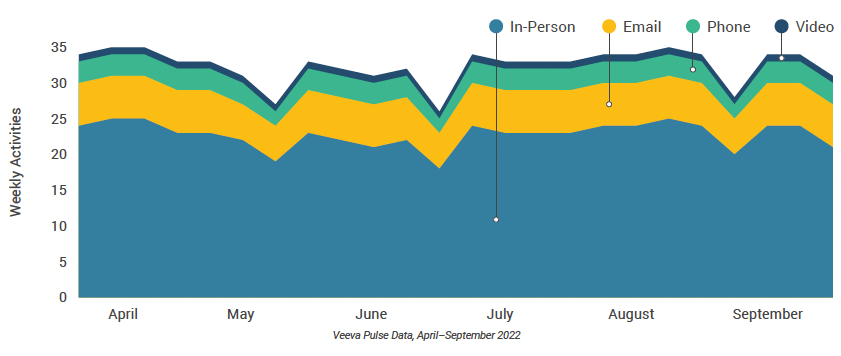
Figure 18 I Activity by User Type
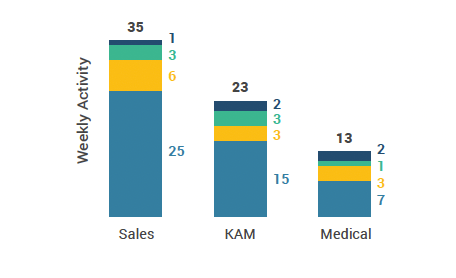
Figure 19 I Activity by Company Size
U.S. Engagement Quality
Consolidation of Key Quality MetricsFigure 20 I Approved Email Volume, U.S.
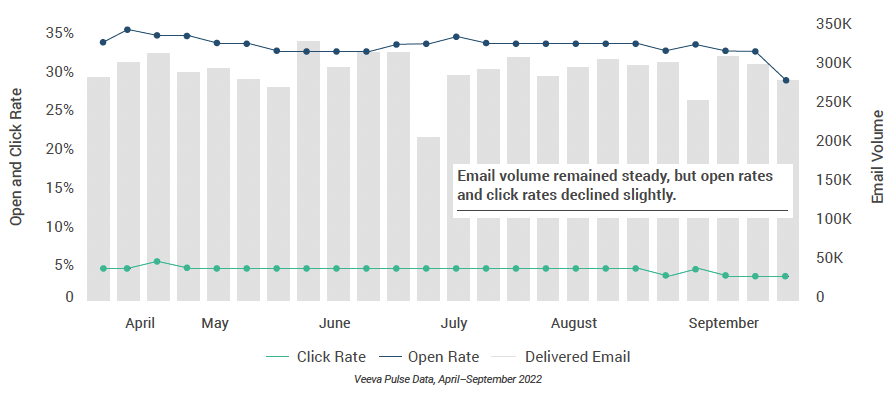
Figure 21 I Content Usage by Channel, U.S.
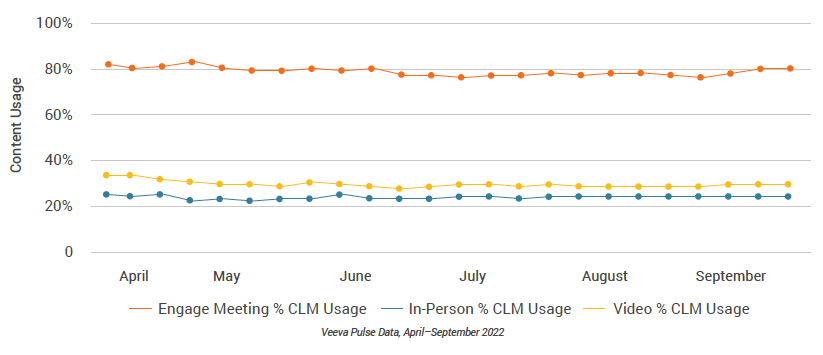
Figure 22 I Engage Meeting Duration, U.S.
Europe market trends
- The European region saw the most dramatic increase in content utilization during this time period. Content utilization in video meetings increased by 10%, while in-person content usage increased by 7% (Figure 29).
- Despite the nearly identical weekly total activity, France and the U.K. significantly differed in how the field engaged with customers. The in-person mix in France was more than double that in the U.K., with the U.K. filling the engagement gap through a higher mix of video and email. Video usage in the U.K. was the highest in Europe at three meetings per user per week.
- Medical users recorded one-third of the email volume compared to sales and KAM users (Figure 26).
Figure 23 I Channel Mix Evolution, Europe
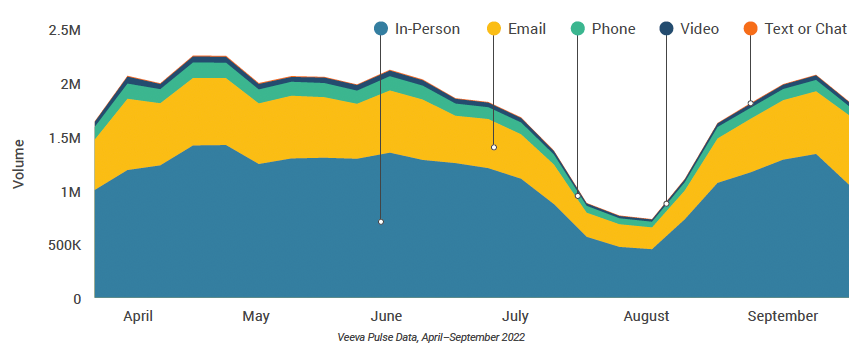
Figure 24 I Channel Mix, Europe
Europe Field Team Activity
Weekly Activity Per User by Engagement ChannelFigure 25 I Activity by Country in Europe
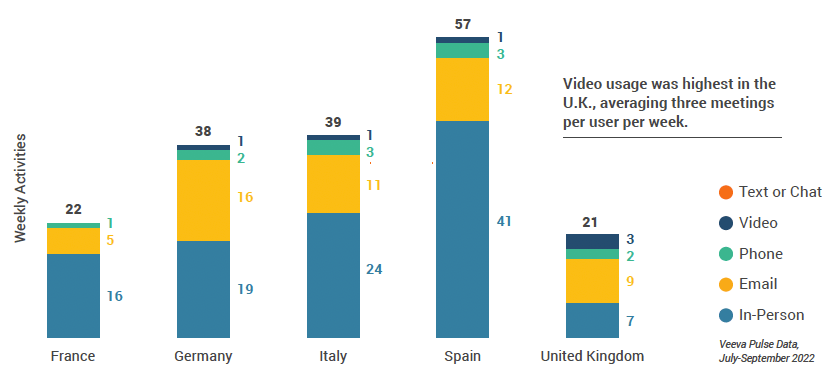
Figure 26 I Activity by User Type
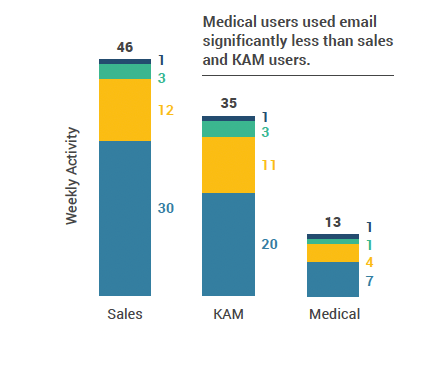
Figure 27 I Activity by Company Size
Europe Engagement Quality
Consolidation of Key Quality MetricsFigure 28 I Approved Email Volume, Europe
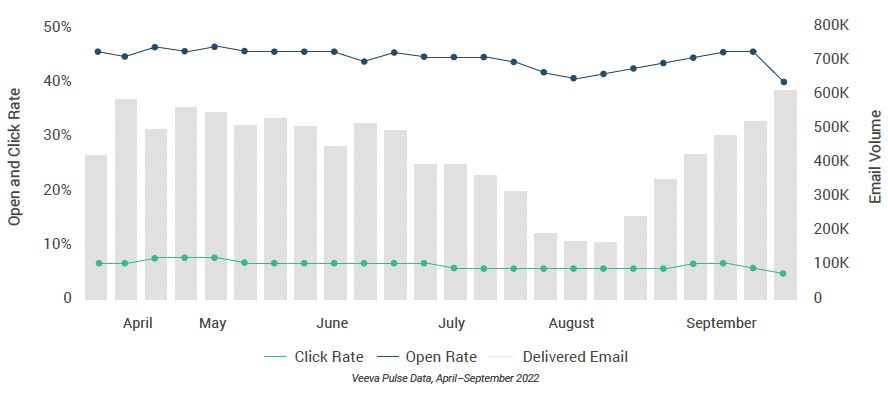
Figure 29 I Content Usage by Channel, Europe
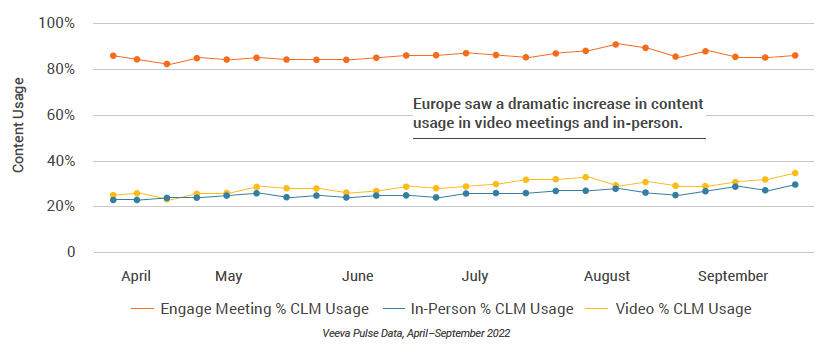
Figure 30 I Engage Meeting Duration, Europe
Asia Pacific market trends
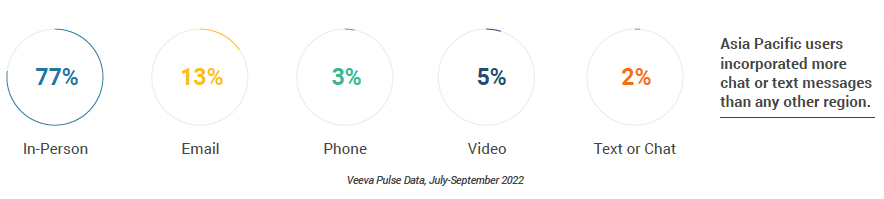
- In-person engagement made up 77% of the channel mix in the Asia Pacific region (Figure 32) this quarter. The Asia Pacific region incorporated more chat or text messages into its channel mix than other regions, representing 2% of total activity (Figure 32).
- Content utilization remained very high, with usage greater than any other major region in each of the three channels (Figure 37). In-person content utilization saw the largest increase, reaching 59% by the end of the quarter.
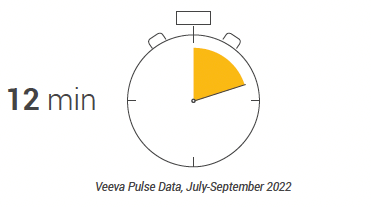
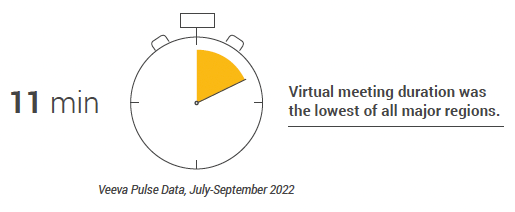
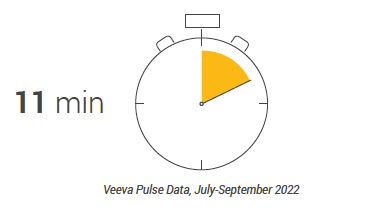
- Veeva Engage meeting duration (11 minutes) was also the lowest of all the major regions (Figure 38).
- India recorded the highest weekly total user activity, with 85 touchpoints per user per week. This was driven by in-person engagement, with 67 in-person touchpoints per week (Figure 33).
Figure 31 I Channel Mix Evolution, Asia Pacific
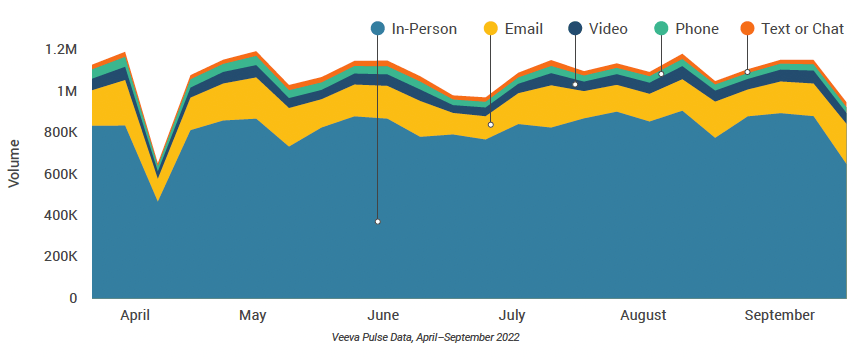
Figure 32 I Channel Mix, Asia Pacific
Asia Pacific Field Team Activity
Weekly Activity Per User by Engagement ChannelFigure 33 I Activity by Country, Asia Pacific
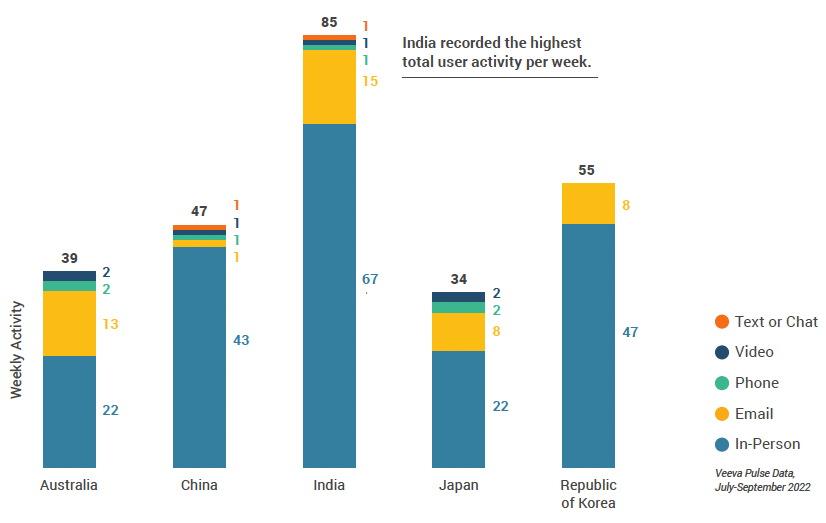
Figure 34 I Activity by User Type
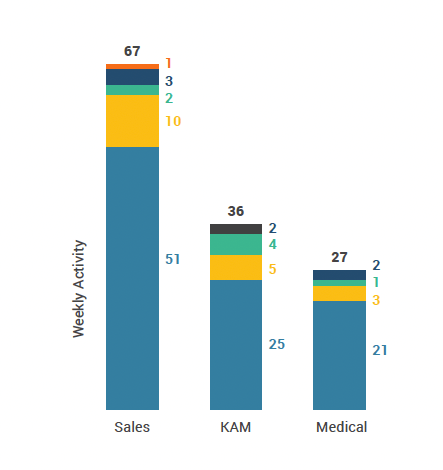
Figure 35 I Activity by Company Size
Asia Pacific Engagement Quality
Consolidation of Key Quality MetricsFigure 36 I Approved Email Volume, Asia Pacific
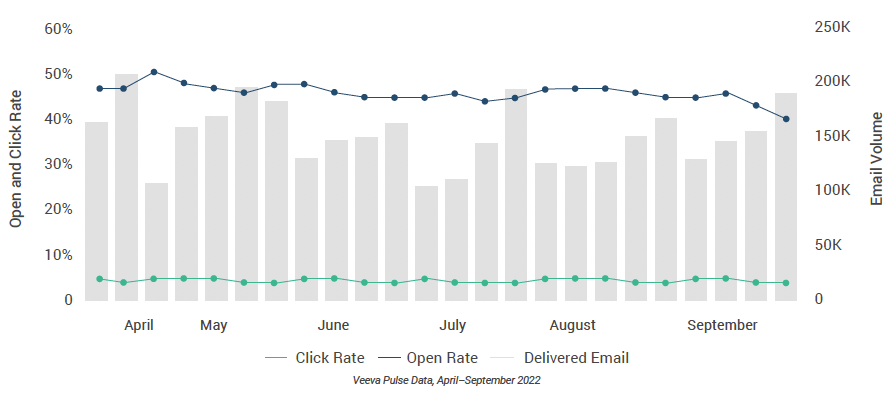
Figure 37 I Content Usage by Channel, Asia Pacific
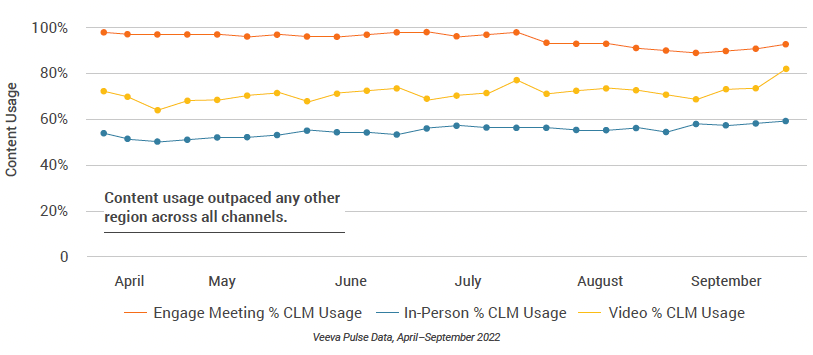
Figure 38 I Engage Meeting Duration, Asia Pacific
Latin America market trends
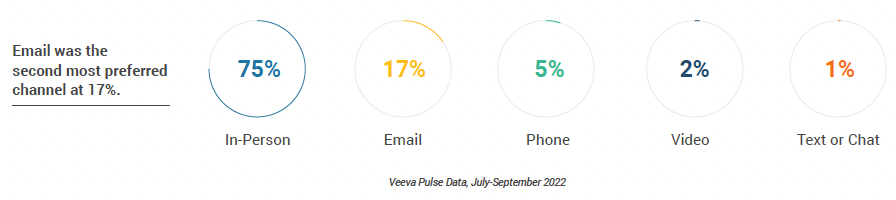
- In Latin America, the volume of total weekly activity remained consistent throughout the quarter. Mirroring global trends, in-person was the preferred HCP engagement channel, accounting for 75% of the channel mix. Email interactions were the second most preferred engagement channel, responsible for 17% of the channel mix (Figure 40).
- Total user productivity was consistently high across all individual markets compared to other major regions, with all markets registering more than 50 touchpoints weekly per user. Countries with higher user productivity, such as Ecuador (67), had greater in-person engagements (52) compared to those with lower user productivity (Figure 41).
- Unique to Latin America, content usage increased across all meeting channels. This improvement was most significant in Veeva CRM Engage meetings, where content usage increased to 91% (Figure 45).
- As expected, sales reps had the highest activity. However, in line with global trends, medical representatives recorded the highest proportion of activity (two calls per user per week) in the video channel (Figure 42).
- The volume of delivered Veeva CRM Approved Email remained consistent throughout the quarter at approximately 150K weekly; however, open rates declined by 6% since April, ending at 40% by the end of the quarter (Figure 44).
Figure 39 I Channel Mix Evolution, Latin America
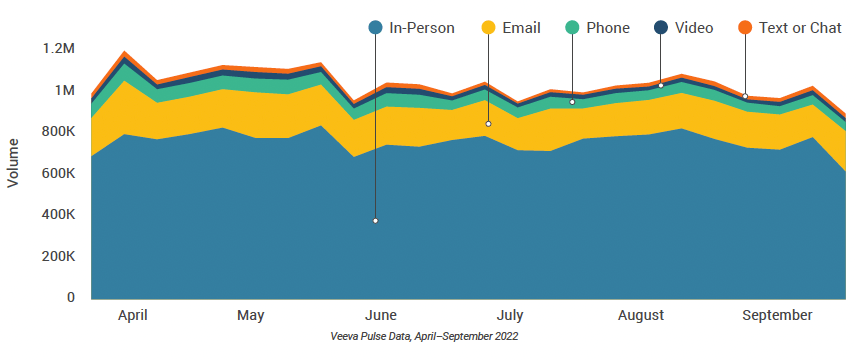
Figure 40 I Channel Mix, Latin America
Latin America Field Team Activity
Weekly Activity Per User by Engagement ChannelFigure 41 I Activity by Country, Latin America
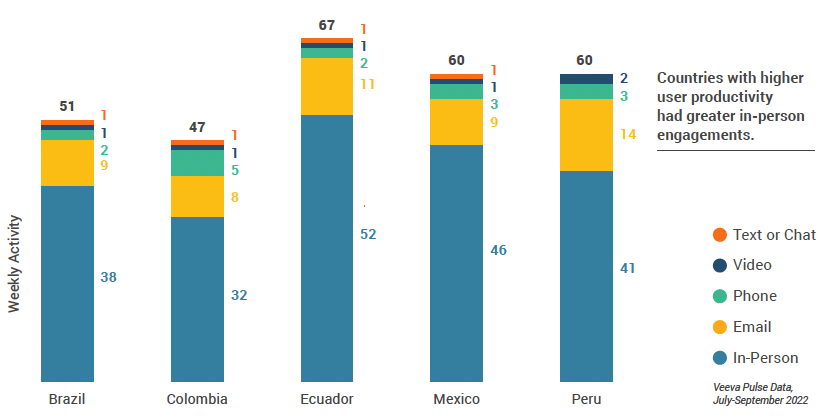
Figure 42 I Activity by User Type
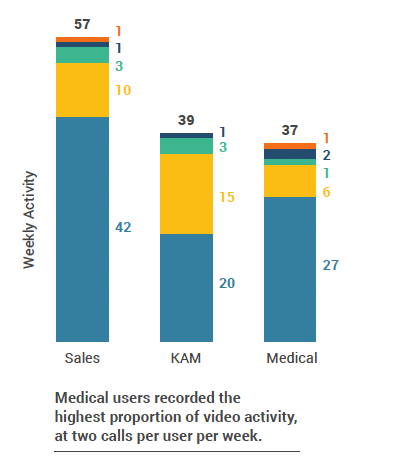
Figure 43 I Activity by Company Size
Latin America Engagement Quality
Consolidation of Key Quality MetricsFigure 44 I Approved Email Volume, Latin America
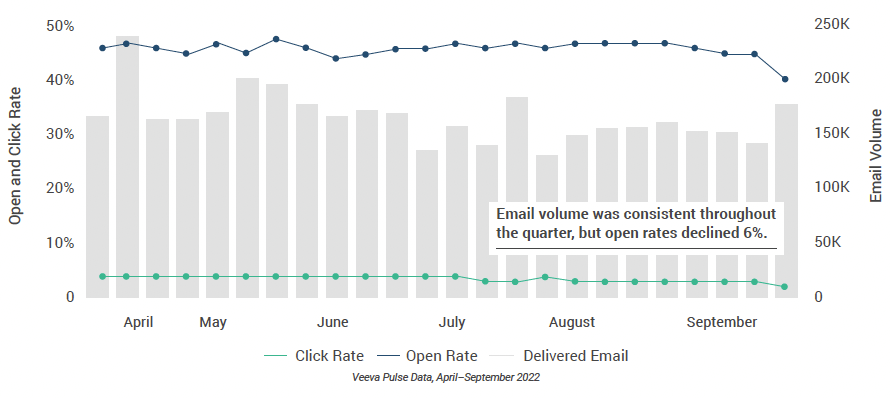
Figure 45 I Content Usage by Channel, Latin America
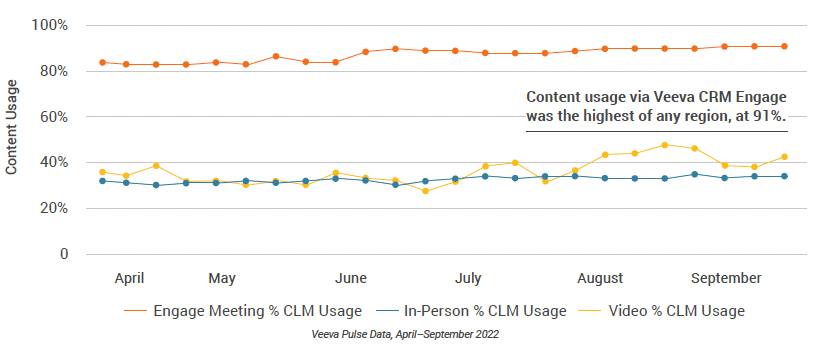
Figure 46 I Engage Meeting Duration, Latin America
Appendix: Data Dictionary
Metric definitions
- Channel Mix Evolution Over Time: Weekly Veeva CRM activity volume broken down by the channel of engagement (in-person, phone, video, email, chat, or text)
- Q2 Channel Mix: Total Veeva CRM activity volume for 2Q22 broken down by engagement channel percentage
- Weekly Activities Per User: The average weekly number of Veeva CRM activities submitted per number of users active in Veeva CRM
- Approved Email Volume: Volume of approved emails sent via Veeva CRM
- Email Open Rate: Percentage of approved emails opened at least once out of all approved emails sent via Veeva CRM
- Email Click Rate: Percentage of approved emails clicked at least once out of all approved emails sent via Veeva CRM
- In-Person % Content Usage: Percentage of in-person engagements that leveraged content in Veeva CRM
- Video % Content Usage: Percentage of video engagements that leveraged content in Veeva CRM
- Engage Meeting % Content Usage: Percentage of Engage meetings that leveraged content in Veeva CRM
- Engage Meeting Duration: The average duration of Engage meetings in minutes
Engagement channel definitions
- In-Person: Submitted Calls with a CRM Standard Metrics call channel value of ‘in-person’
- Phone: Submitted Calls with a CRM Standard Metrics call channel value of ‘phone’
- Video: Veeva Engage Calls and Video Calls via other platforms that are then recorded as calls in Veeva CRM with a Standard Metrics call channel value of ‘video’
- Email: Approved Emails and Emails sent via other platforms that are then recorded as calls in Veeva CRM with a Standard Metrics call channel value of ‘email’
- Chat or Text: Submitted calls with a CRM Standard Metrics call channel value of ‘chat or text’
User type definitions
- Sales: Users that have been classified with the ‘Sales’ value in the CRM Standard Metrics user type field
- Key Account Manager: Users that have been classified with the ‘Key Account Manager’ value in the CRM Standard Metrics user type field
- Medical: Users that have been classified with the ‘medical’ value in the CRM Standard Metrics user type field
Company size definitions
- Top Global Pharma: Veeva CRM customers included in the top 17 pharma companies based on global revenue
- Rest of Industry: All other Veeva CRM customers
- Weighted Average: All companies based on access
Methodology
The Veeva Pulse Field Trends Report is a quarterly industry benchmark for global and regional healthcare professional (HCP) engagement across the life sciences industry. The report is based on proprietary Veeva Pulse data and insights from field engagement activities of more than 80% of all industry representatives worldwide (Asia Pacific, Europe, Latin America, and the United States). Veeva CRM Standard Metrics—now used industrywide—provides the basis for consistent collection and measurement of engagement KPIs including channel mix and productivity across regions, roles, and market segments. The findings are based on approximately 235 million global field representative activities captured in Veeva CRM and Veeva CRM Engage, as well as 42+ billion prescription (Rx) and medical (Mx) records captured in Veeva Compass, a U.S.-based longitudinal patient claims data set, between April and September 2022.
The Veeva Pulse Field Trends Report delivers insights that inform the industry and help field teams align their strategy to key market trends for improved commercial success. The global Veeva Business Consulting team also helps customers inform their strategies using industry benchmarking with Veeva Pulse data.