Industry Report
Veeva Pulse Field Trends Report Q4 2022
Digital Content More Than Doubles Promotional Response
When sales reps share digital content during meetings with healthcare professionals (HCPs) it has a measurable promotional impact – but more than 60% of rep-HCP interactions miss the opportunity. New Veeva Pulse data shows that focusing on high-impact content and training your field team on effective usage can improve commercial success.
Veeva Pulse data – the largest ever analysis of 600 million annual HCP-rep interactions globally across more than 80% of the industry – for Q4 2022 reveals that:
- Sales rep calls that share digital content drive 2.5x new patient starts over calls that don’t share content.
- Globally, field teams share digital content in just 39% of meetings, underscoring the opportunity to use content more frequently and effectively.
- Field teams that use content the most outpace lagging companies at a rate of 4:1, a significant competitive advantage.
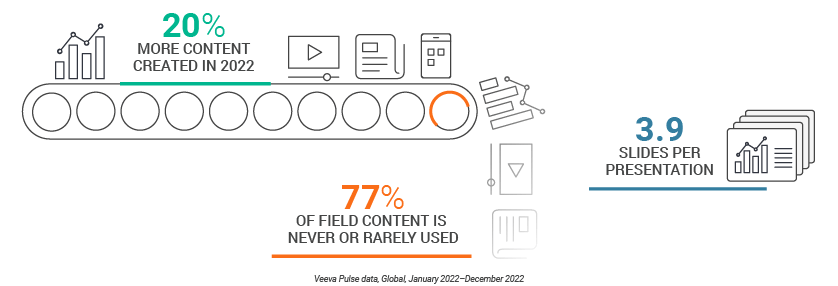
- Even though biopharmas created 20% more content over the previous year, 77% of that content is rarely or never used by field teams.
Although this data shows that content can and should be used more widely to engage HCPs, creating more content isn’t the answer – in fact, it could be slowing you down. This is why leading biopharmas are focusing on content assets with high field buy-in and a measurable impact on HCP engagement to drive commercial success.
Read on for Veeva Business Consulting’s in-depth analysis of content usage and recommended actions.
Thank you,

Dan Rizzo
Vice President, Business Consulting, Veeva
Digital content usage drives 2.5x new patient starts
As detailed in previous Pulse reports, HCP access is better than you might think, but it can still be a challenge for biopharma field reps to reach target HCPs. Once they do, making the most of these limited opportunities is essential for commercial success.
Veeva Pulse and Compass data show that sharing digital content during HCP meetings drives new patient starts 2.5x more than meetings that don’t use it. This increased promotional impact is consistent across both in-person and video channels.
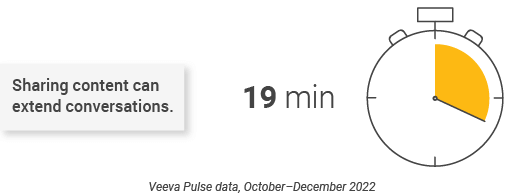
Digital content sharing has benefits beyond educating HCPs on the scientific evidence supporting a given treatment and answering common questions. It’s also an effective way to extend meeting duration, create opportunities for follow-up touchpoints via digital channels, and give your team valuable, measurable data on content effectiveness.
Promotional impact of digital content
In-person and video meetings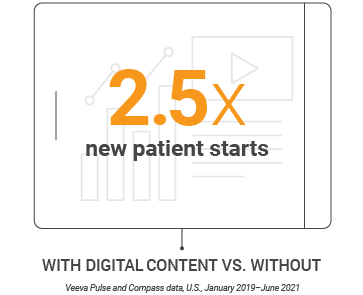
Content leaders outpace laggards by 4:1
Despite the clear benefits of digital content sharing, global field teams only use it in 39% of HCP meetings on average. Veeva Pulse data also shows a wide gap between companies that use content the most vs. companies that use it the least. The top three organizations use content in nearly 70% of meetings, compared to just 18% for the bottom three organizations, nearly a 4:1 difference.
Percent of rep-HCP meetings using digital content
In-person and video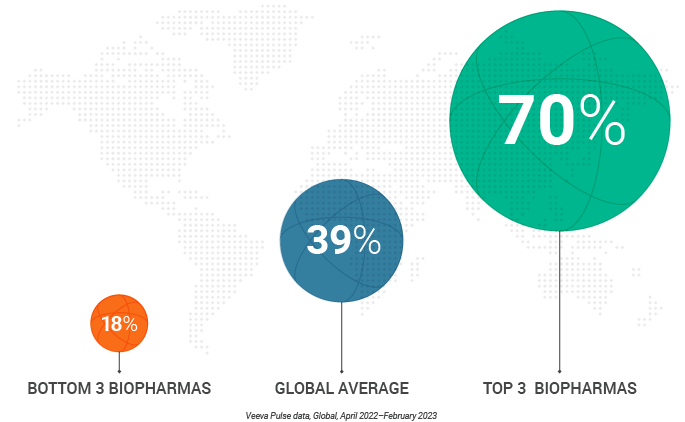
Because digital content is shown to have a clear promotional impact, using it effectively is a competitive advantage. Field teams should benchmark their digital content usage against their competitors to identify gaps in their content strategy. Modular content, for example, is just one way to optimize your content factory by balancing personalization with speed and scale.
Content quality is more important than quantity
The pandemic put omnichannel marketing strategies – including content – into overdrive. But even as the pandemic wanes, content production continues to increase. Globally, biopharmas created 20% more content in 2022 vs. 2021, with little signs of slowing down. Much of this content – and the resources needed to create it – are wasted.
Veeva Pulse data shows that 77% of field content is never or rarely used. An analysis of slide presentations shown by sales reps during meetings with HCPs shows that the average meeting uses less than four slides. Those few slides, however, can still carry a major promotional impact.
Biopharmas should focus their content strategy on fewer content assets that have high field buy-in, get used more frequently, and create impactful discussions with HCPs. This approach can eliminate unused content and redirect resources to training and creating high-impact content that resonates with HCPs. This is a key reason companies like Sanofi are building content strategies that deliver more connected, personalized HCP experiences.
Reach out to Veeva Business Consulting to find out how you can use this industry data to measure your content strategy relative to the industry, improve field execution, and achieve commercial excellence.
Global and Regional Trends
This report highlights global and regional field engagement trends from Veeva Pulse data between April and December 2022. Veeva Pulse data is sourced from Veeva’s aggregated CRM activity dataset, inclusive of field engagement stats from all instances of Veeva CRM globally. This report also includes insights from Veeva Pulse Content Metrics, the first and only industry benchmark for commercial content performance based on real-world, anonymized data collected across 350+ global pharma companies.
Global trends
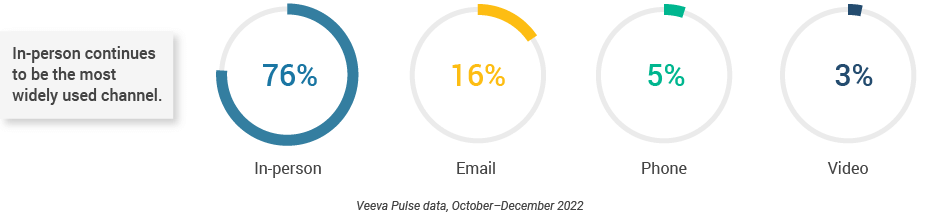
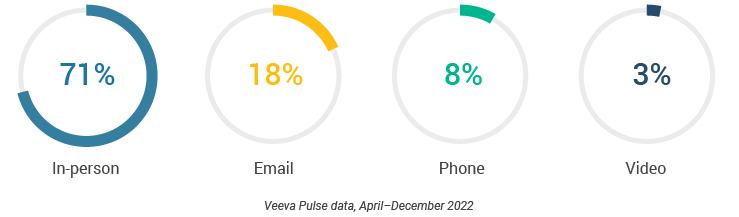
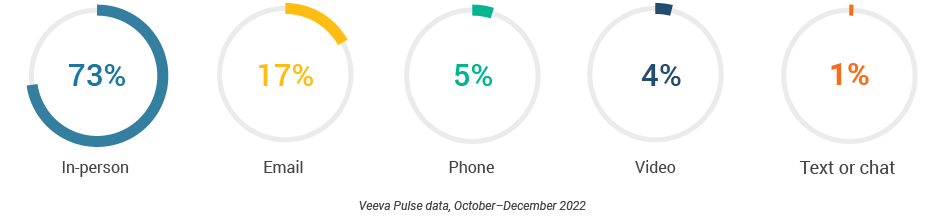
- In-person meetings (76%) create the foundation for HCP engagement, with virtual channels (24%) extending the conversation (Figure 2).
- Although just 3% of the channel mix, video engagement effectively lengthens meetings and enables content sharing.
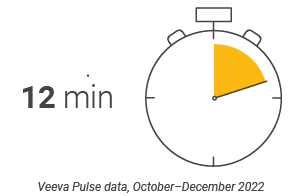
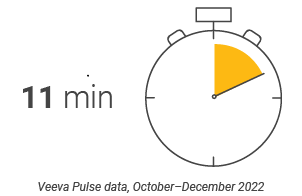
- Veeva CRM Engage meetings averaged 19 minutes and had 85% content usage (Figures 7 and 8).
- Asia and Latin America continued to have the highest volume of interactions (Figure 3), and video usage was highest in Asia with three video meetings per rep per week.
- Content review times fluctuated significantly around the holidays (Figure 9), with an annual low in November (13.5 days) and a new high (17 days) at the end of the year.
- Content drives HCP engagement and promotional response; MLR forecasting and resource capacity planning are critical to ensure timely approval during slow periods.
Figure 1: Channel mix evolution
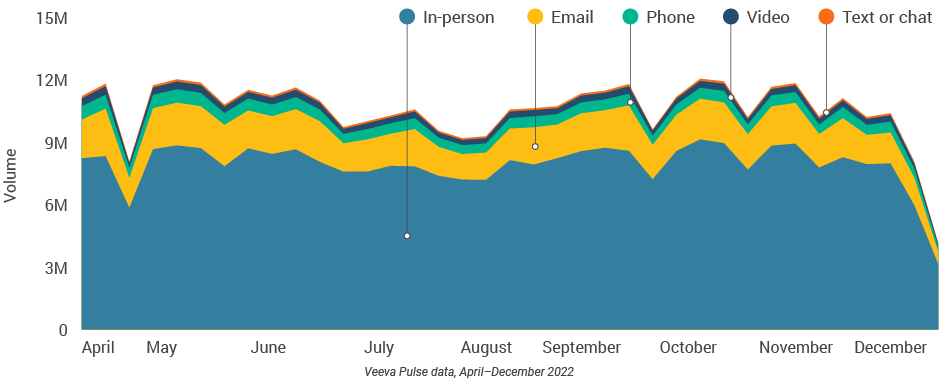
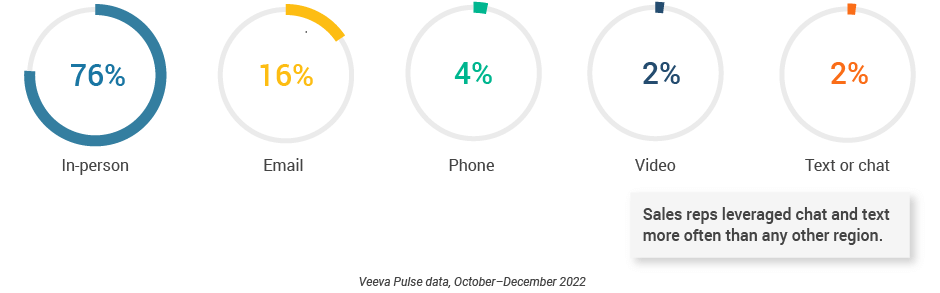
Figure 2: Channel mix
Global field team activity Weekly activity per user by engagement channel
Figure 3: Activity by region
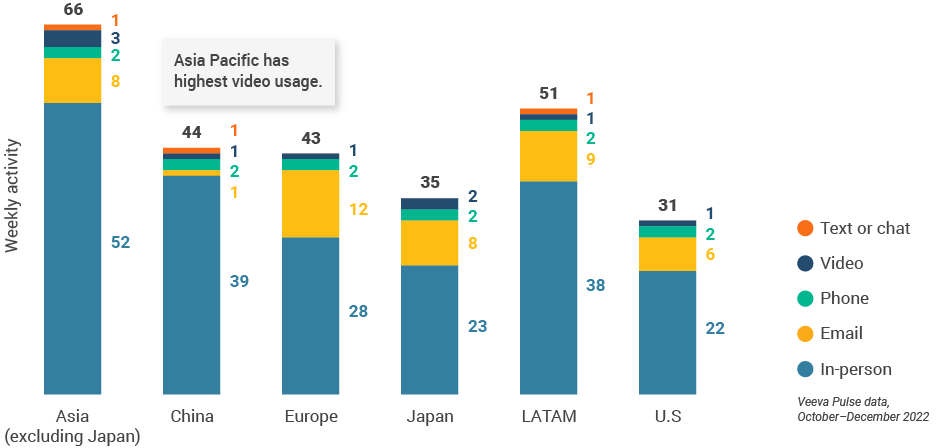
Figure 4: Activity by user type
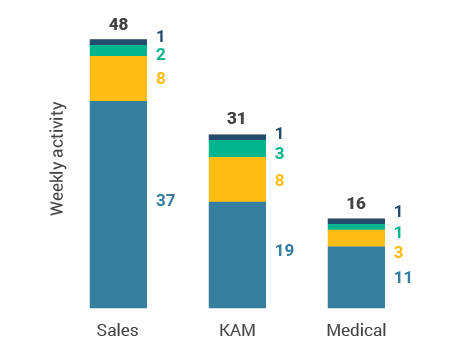
Figure 5: Activity by company size
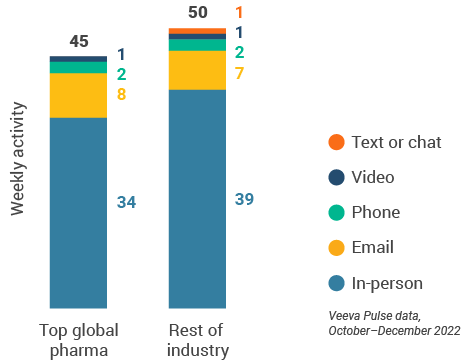
Figure 4: Activity by user type
Figure 5: Activity by company size
Global engagement quality Consolidation of key quality metrics
Figure 6: Approved email volume
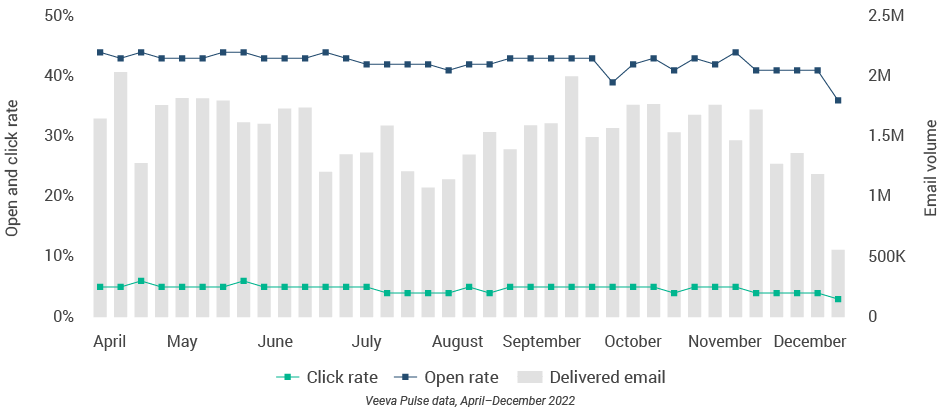
Figure 7: Content usage by channel
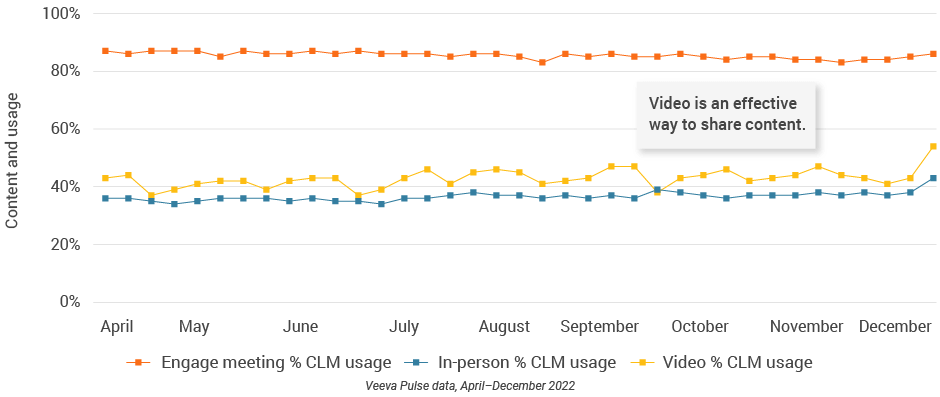
Figure 8: Engage meeting duration
Global content production Speed and efficiency metrics
Figure 9: Days in review, global
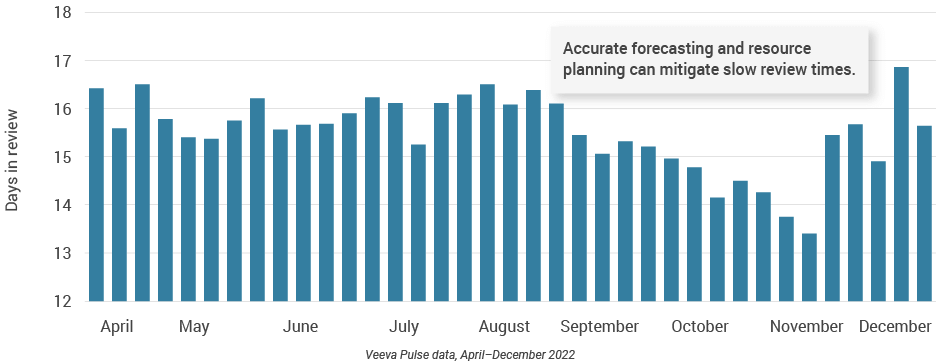
Figure 10: Days to approval, global
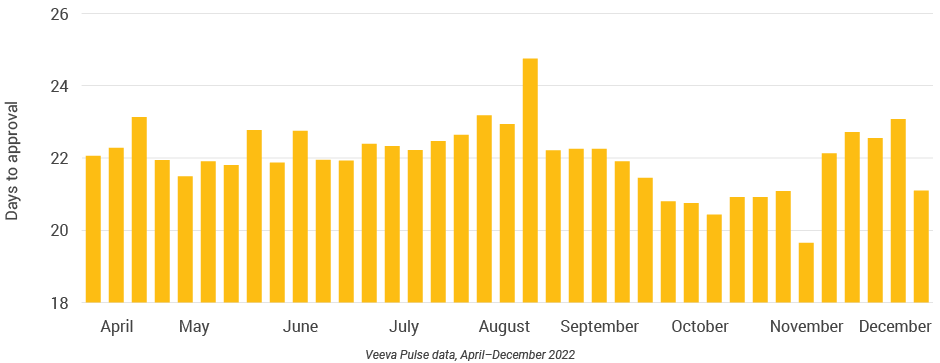
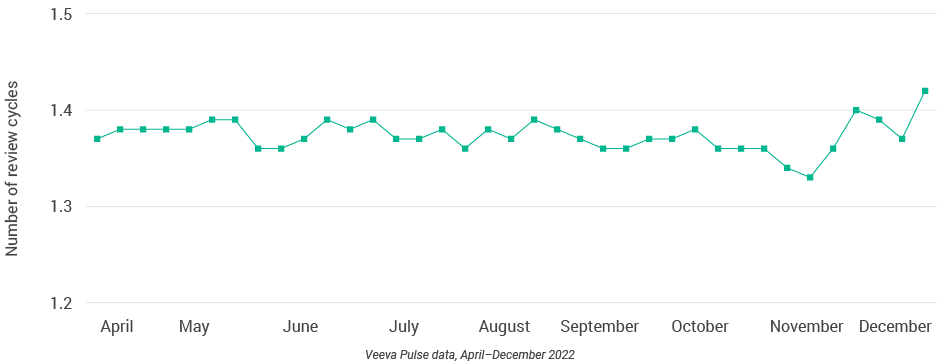
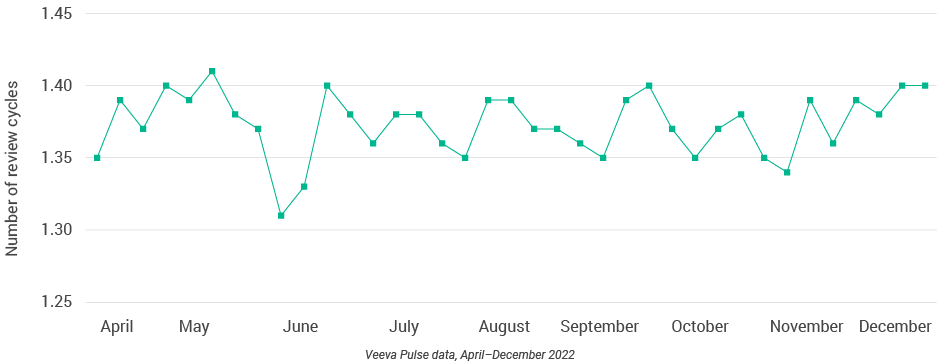
Figure 11: Number of review cycles, global
U.S. market trends
- The U.S. channel mix was 71% in-person and 29% virtual (Figure 13). Despite a small decline via CRM Engage video, content usage rose slightly via in-person and other video platforms (Figure 18).
- CLM usage effectively increases HCP engagement, drives message retention, and generates insights across channels.
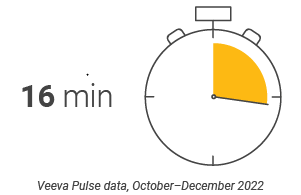
- U.S. tied with Asia for longest customer meetings (16-minute average within Veeva CRM Engage calls) but had the lowest number of sales rep activities per week (Figure 15).
- U.S. phone, video, and email productivity lags behind other regions. U.S. reps should consider opportunities to increase digital channel usage.
- Content review and approval times in the U.S. remained steady, despite a holiday spike when reviews rose to nearly 25 days and approvals to 33 days (Figures 20 and 21).
- The U.S. has longer content approval times than other major regions; an agile approach — such as modular content — can improve speed to market.
Figure 12: Channel mix evolution, U.S.
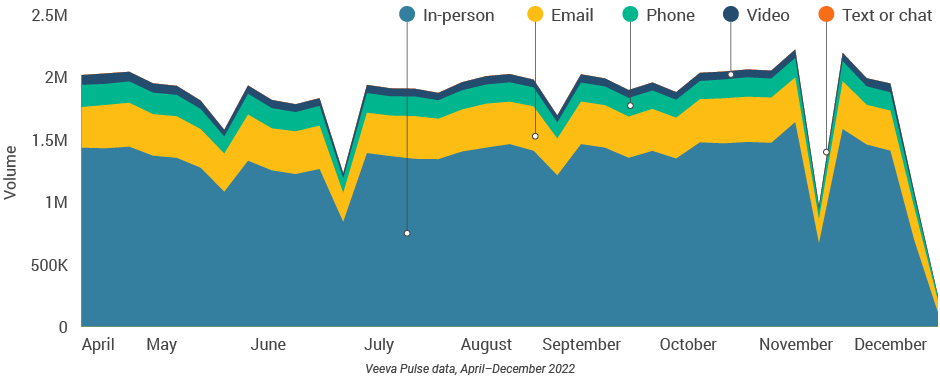
Figure 13: Channel mix, U.S.
U.S. field team activity Weekly activity per user by engagement channel
Figure 14: Activity, U.S.
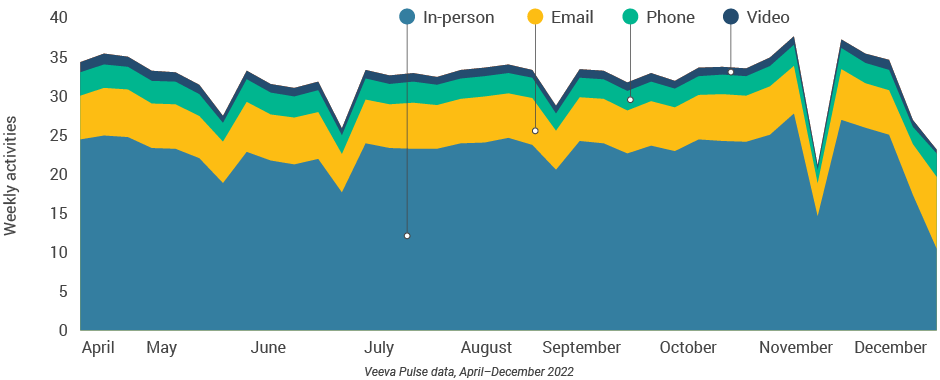
Figure 15: Activity by user type
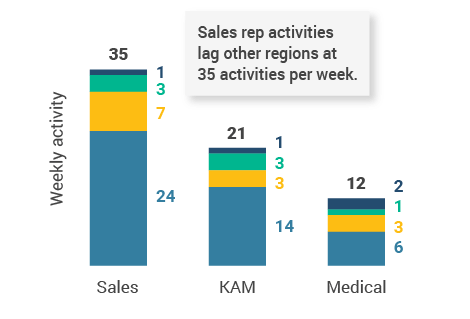
Figure 16: Activity by company size
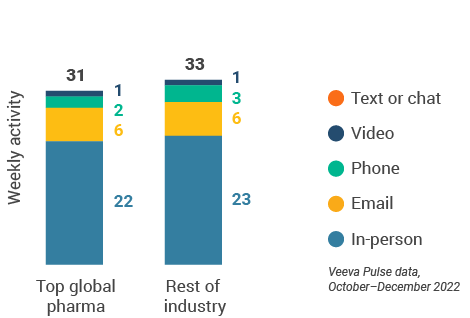
Figure 15: Activity by user type
Figure 16: Activity by company size
U.S. engagement quality Consolidation of key quality metrics
Figure 17: Approved email volume, U.S.
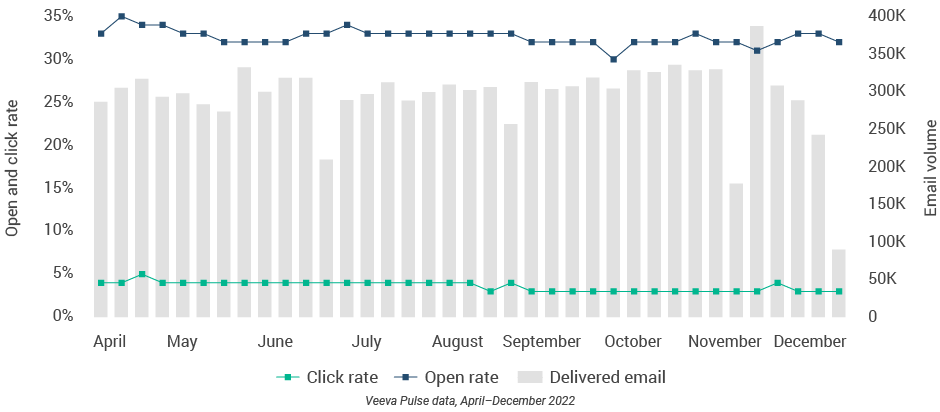
Figure 18: Content usage by channel, U.S.
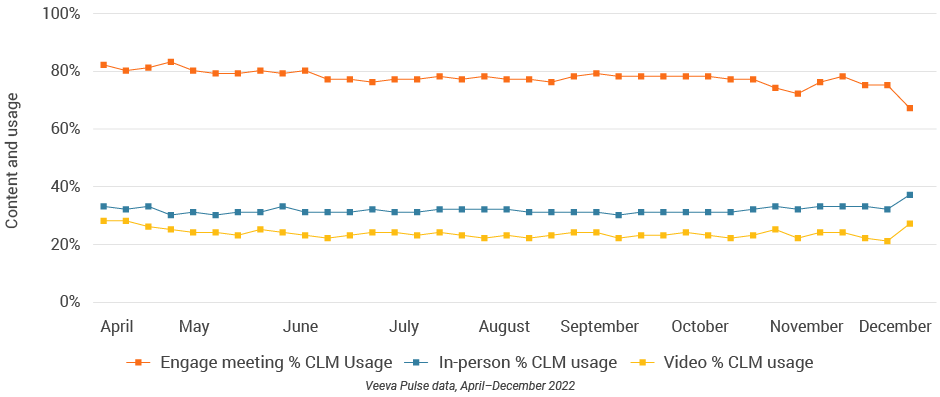
Figure 19: Engage meeting, U.S.
U.S. content production Speed and efficiency metrics
Figure 20: Days in review, U.S.
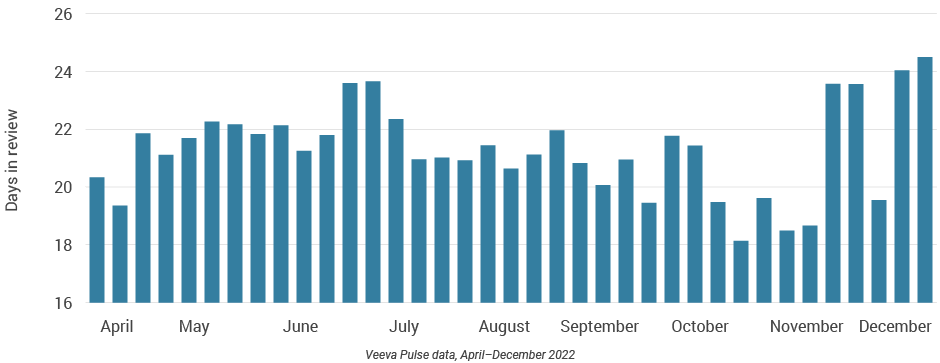
Figure 21: Days to approval, U.S.
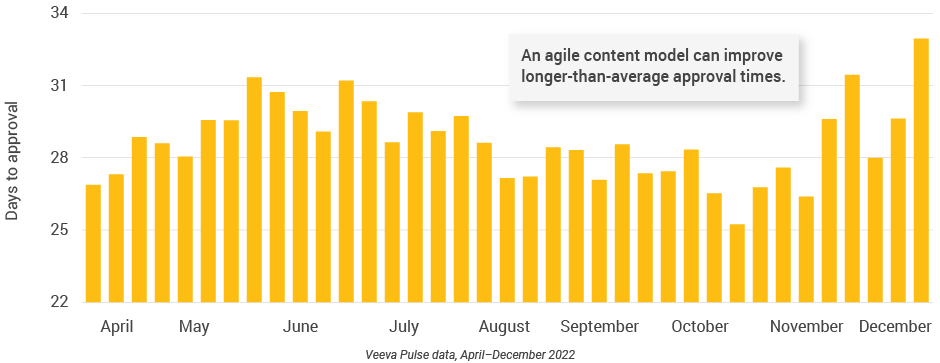
Figure 22: Number of review cycles, U.S.
Europe market trends
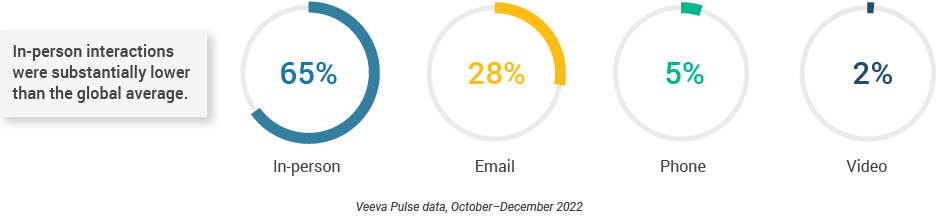
- The channel mix in Europe was consistent from the last quarter; however, in-person interactions (65%) were substantially lower than the global average (Figure 24).
- Germany led the region in email usage at 18 per user per week, and Spain led in-person touchpoints with 45 meetings per user per week (Figure 25).
- With large degrees of variation in engagement trends, a data-driven approach can optimize HCP engagement strategies for regional preferences.
- Remote meeting duration was lower than in other regions, but CLM usage increased across all channels, including an in-person peak of 30% CLM usage (Figure 29).
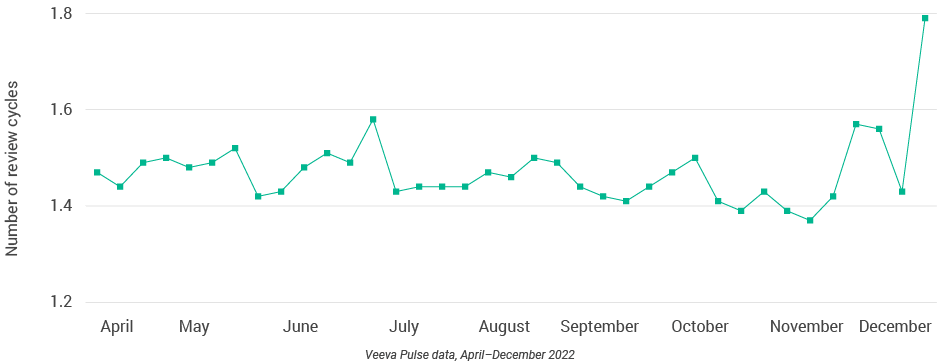
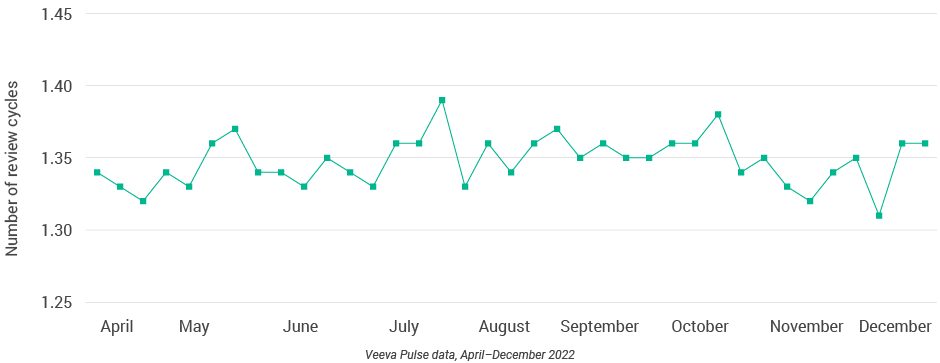
- Content speed and efficiency improved across Europe. Although the number of review cycles remained consistent, this quarter recorded some of the shortest days to approval (less than 20 days) and days in review (12 days) since April 2022 (Figures 31 and 32).
- Content reuse and modular content strategies can shorten review and approval cycles.
Figure 23: Channel mix evolution, Europe
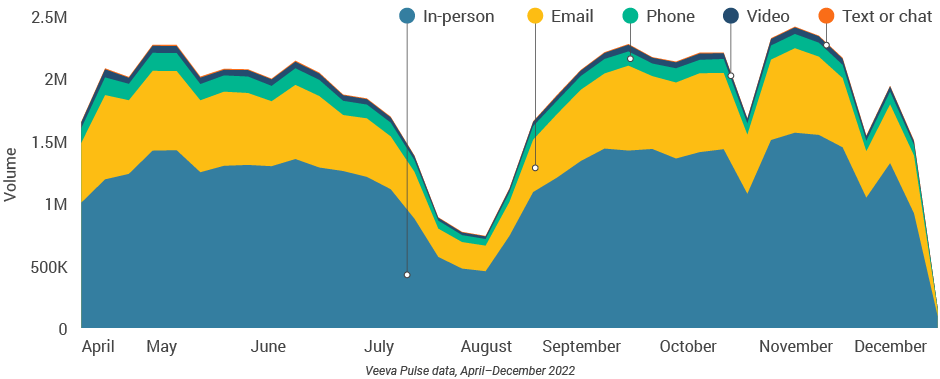
Figure 24: Channel mix, Europe
Europe field team activity Weekly activity per user by engagement channel
Figure 25: Activity by country, EU5
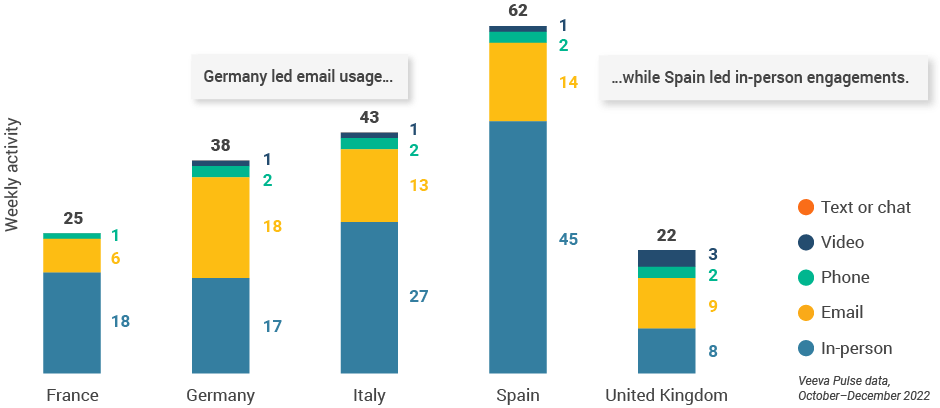
Figure 26: Activity by user type
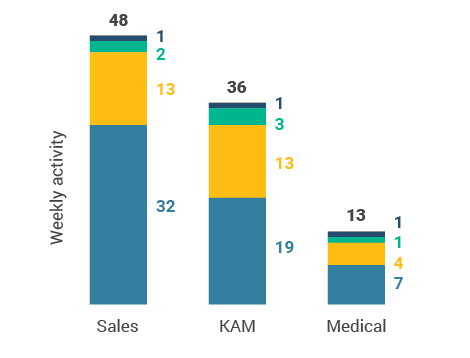
Figure 27: Activity by company size
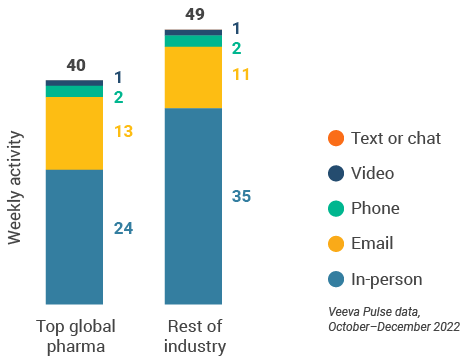
Figure 26: Activity by user type
Figure 27: Activity by company size
Europe engagement quality Consolidation of key quality metrics
Figure 28: Approved email volume, Europe
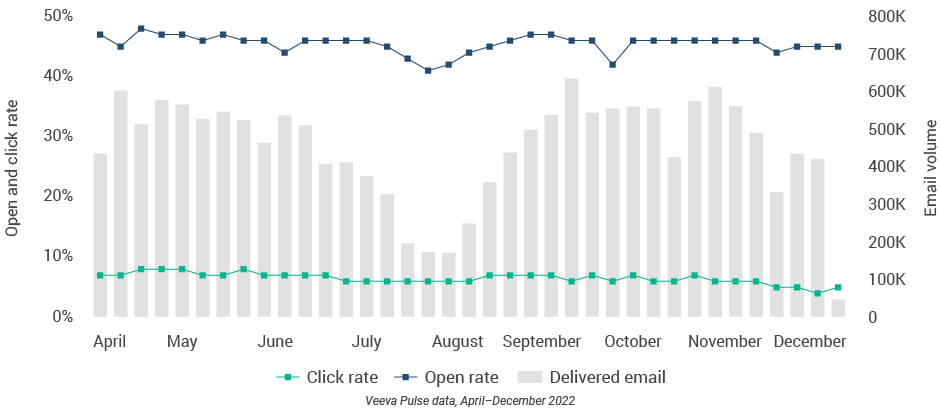
Figure 29: Content usage by channel, Europe
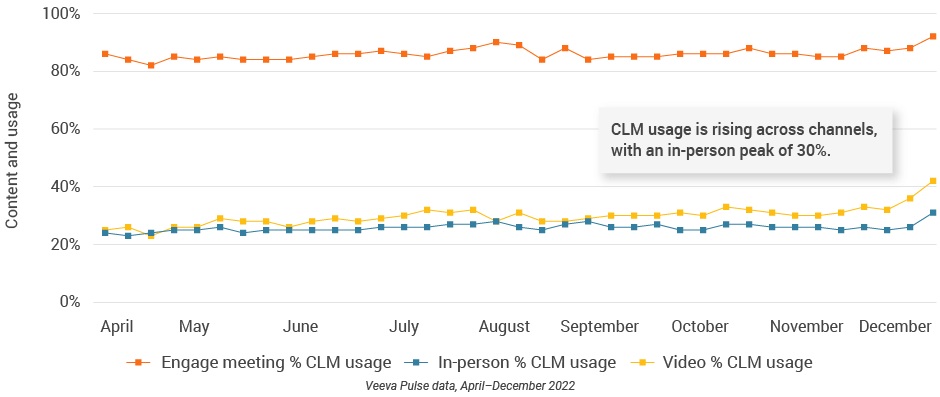
Figure 30: Engage meeting duration, Europe
Europe content production Speed and efficiency metrics
Figure 31: Days in review, Europe
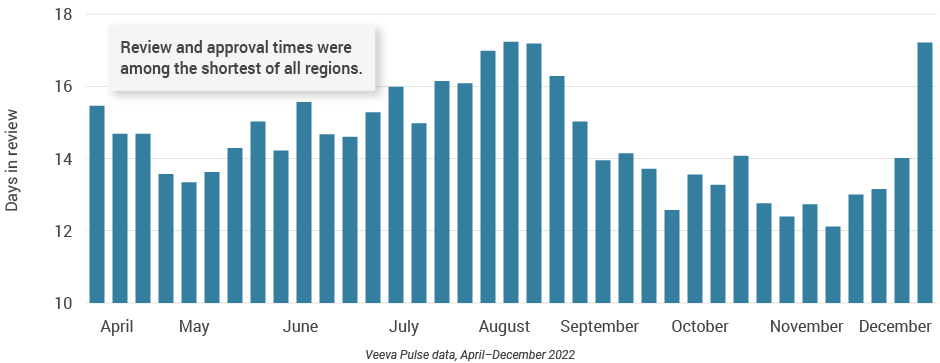
Figure 32: Days to approval, Europe
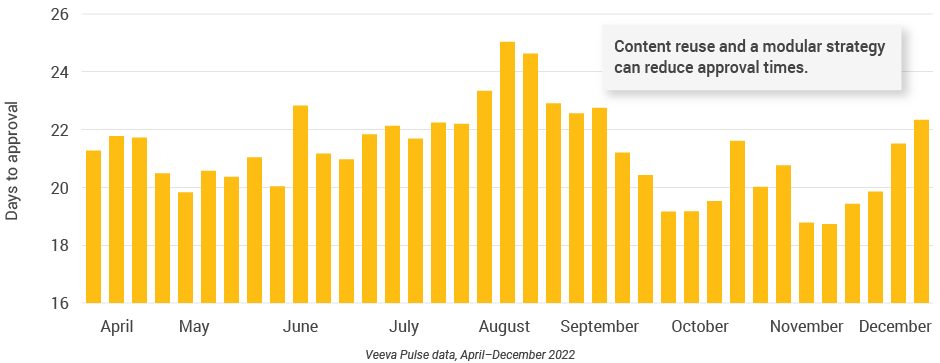
Figure 33: Number of review cycles, Europe
Asia market trends
- Asia had the highest use of CLM during engagements globally, and usage continued to rise this quarter.
- Over 60% of video calls leveraged CLM in the last week of December (Figure 40).
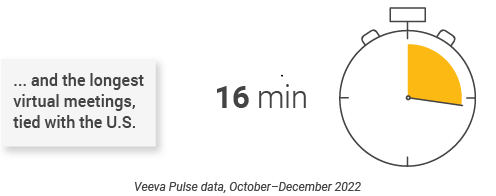
- Asia had some of the longest virtual meetings at 16 minutes (Figure 41) and the highest approved email open rates at 50% (Figure 39), suggesting organizations are adept at building a high volume of content that resonates with customers.
- Asia brought content to market faster than any other region (Figure 43), demonstrating an efficient content model.
- The Philippines had the highest video productivity (eight per user per week) and chat or text (seven per user per week) usage of the five major Asian countries (Figure 36), showcasing the potential of digital channels in this region.
- High digital channel usage increased productivity in this market, outpacing the average of 47 total interactions per sales rep per week.
Figure 34: Channel mix evolution, Asia
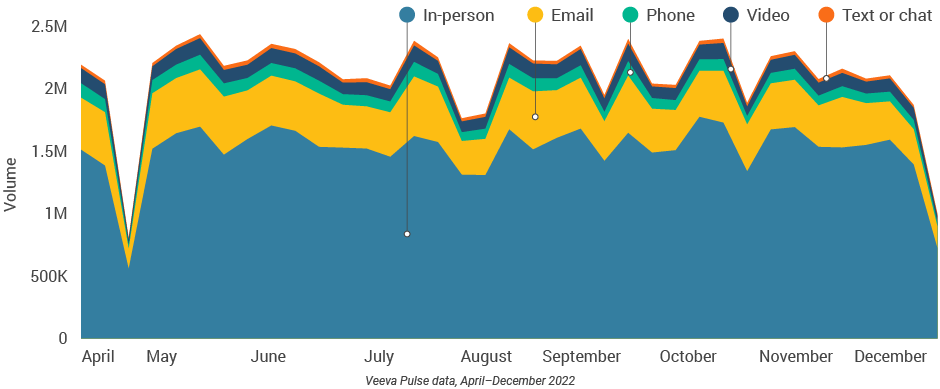
Figure 35: Channel mix, Asia
Asia field team activity Weekly activity per user by engagement channel
Figure 36: Activity by country, Asia
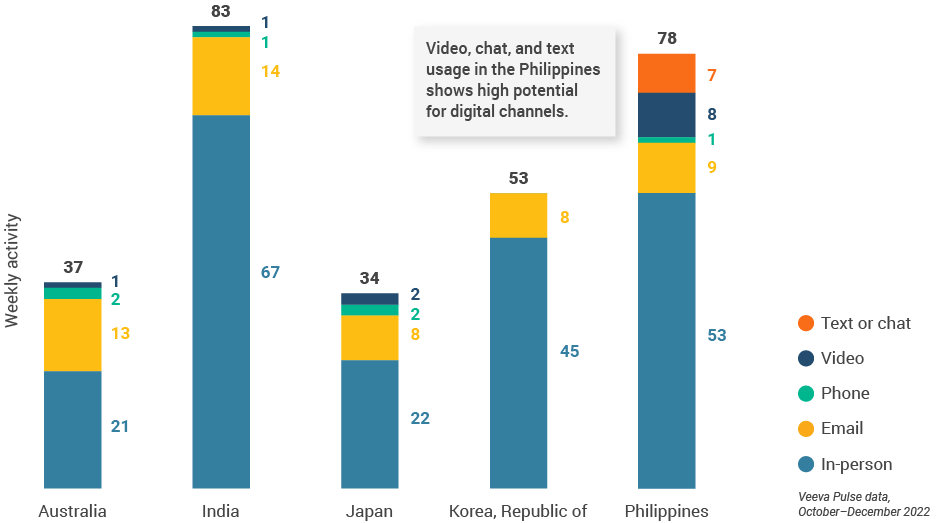
Figure 37: Activity by user type
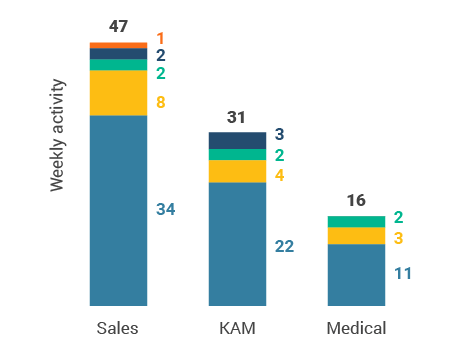
Figure 38: Activity by company size
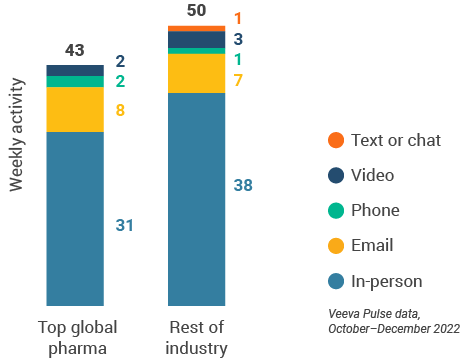
Figure 37: Activity by user type
Figure 38: Activity by company size
Asia engagement quality Consolidation of key quality metrics
Figure 39: Approved email volume, Asia
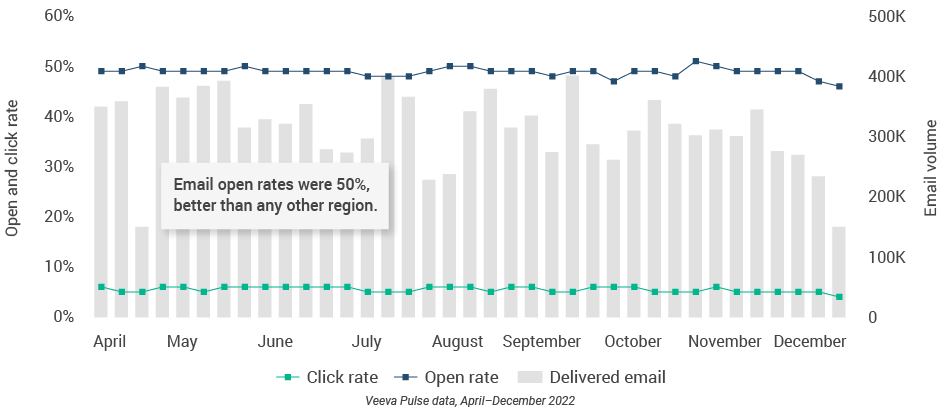
Figure 40: Content usage by channel, Asia
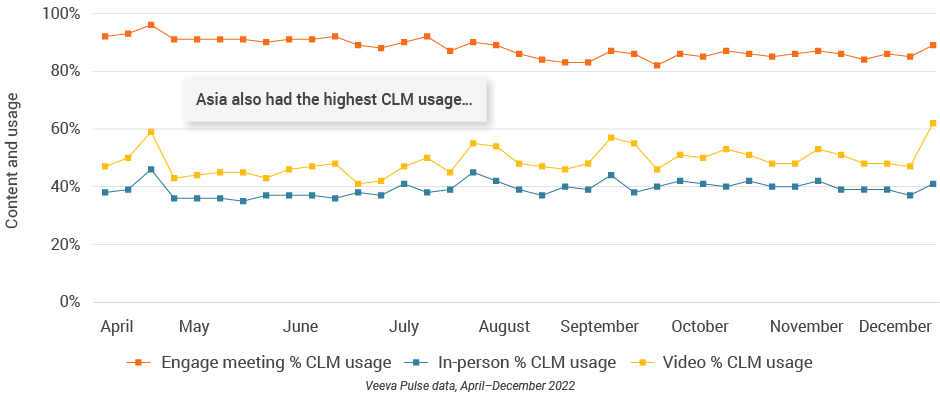
Figure 41: Engage meeting duration, Asia
Asia content production Speed and efficiency metrics
Figure 42: Days in review, Asia
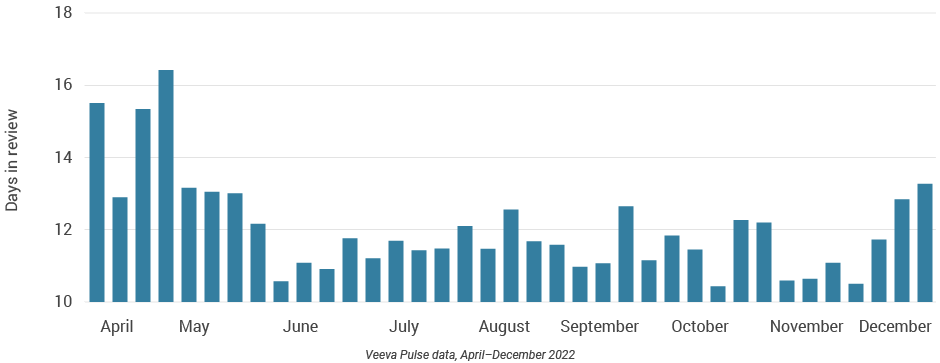
Figure 43: Days to approval, Asia
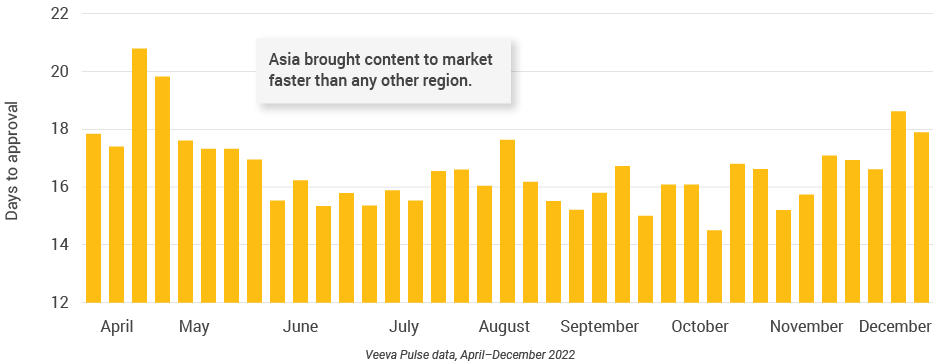
Figure 44: Number of review cycles, Asia
Latin America market trends
- The main HCP engagement channels in Latin America were in-person and email.
- Sales reps leveraged chat and text at a higher rate (2%) than the global average (Figure 46), indicating that HCPs in this region are open to more personalized engagement.
- Medical users leveraged chat, text, and video channels as a larger percentage of their channel mix than sales and KAM users (Figure 48), underscoring how digital channels can drive scientific conversations with HCPs across broader geographies.
- Approved email volumes and open rates declined throughout the quarter (Figure 50), while content approval times steadily increased (Figure 54).
- This correlation suggests the decline in approved email could be related to lagging approvals, creating a shortage of new content and underscoring the need for efficient content processes.
Figure 45: Channel mix evolution, Latin America
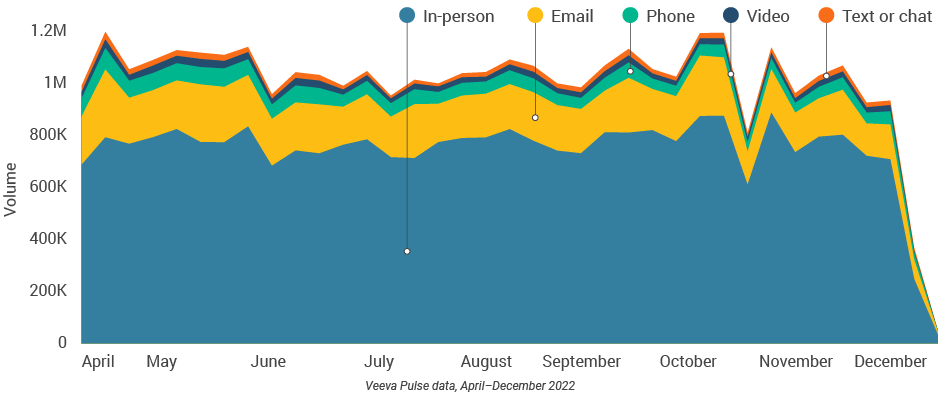
Figure 46: Channel mix, Latin America
Latin America field team activity Weekly activity per user by engagement channel
Figure 47: Activity by country, Latin America
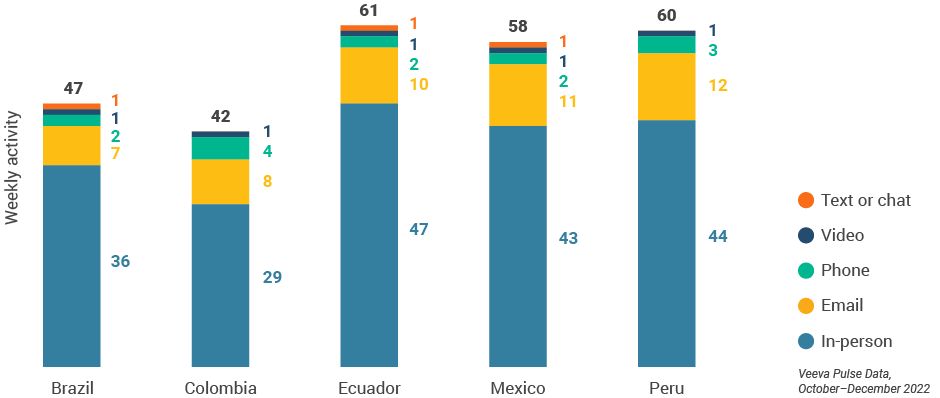
Figure 48: Activity by user type
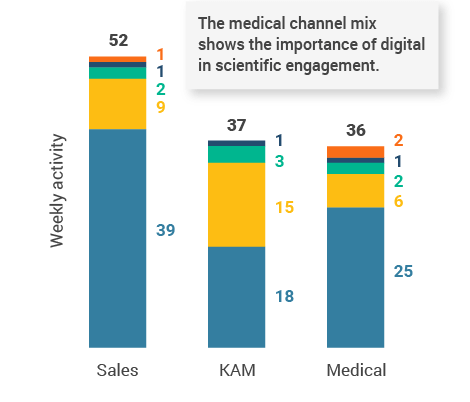
Figure 49: Activity by company size
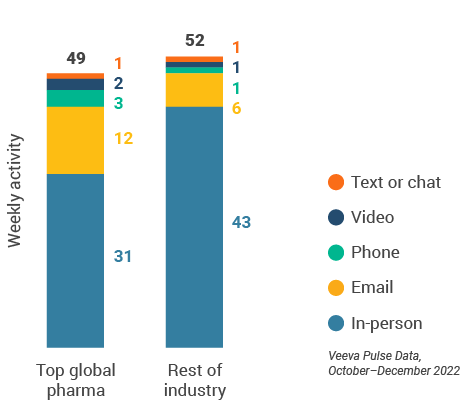
Figure 48: Activity by user type
Figure 49: Activity by company size
Latin America engagement quality Consolidation of key quality metrics
Figure 50: Approved email volume, Latin America
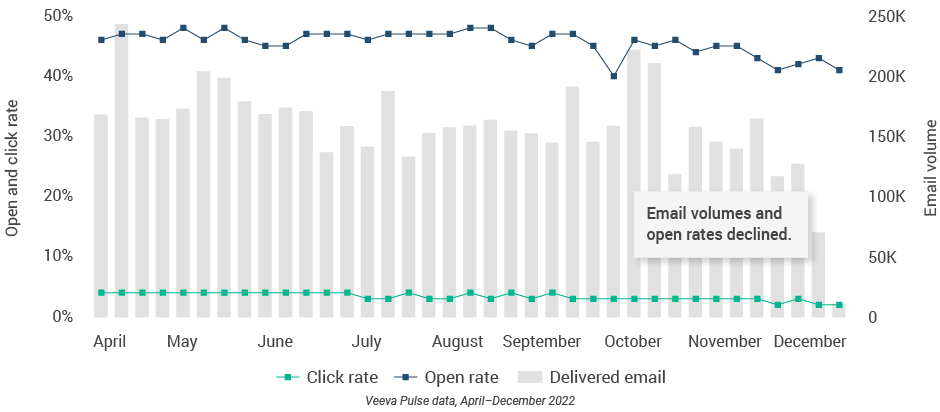
Figure 51: Content usage by channel, Latin America
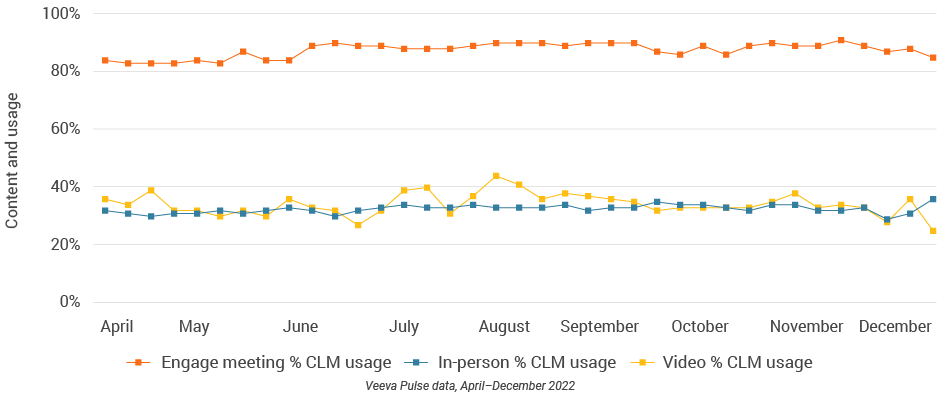
Figure 52: Engage meeting duration, Latin America
Latin America content production Speed and efficiency metrics
Figure 53: Days in review, Latin America
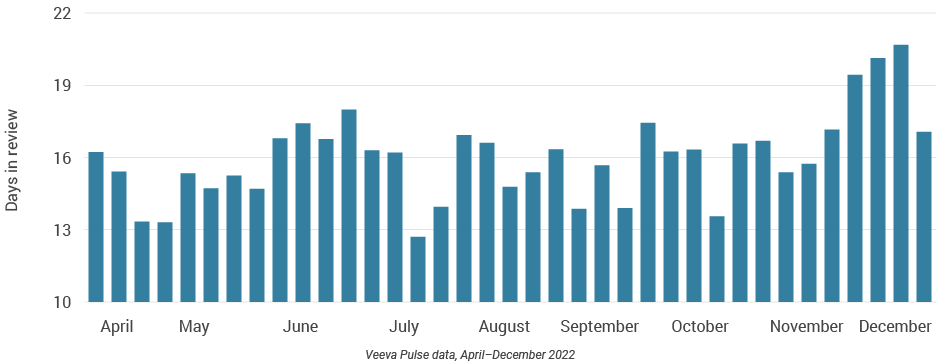
Figure 54: Days to approval, Latin America
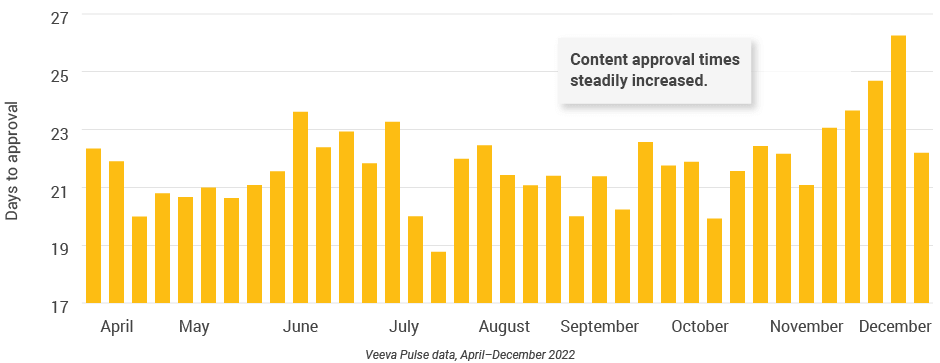
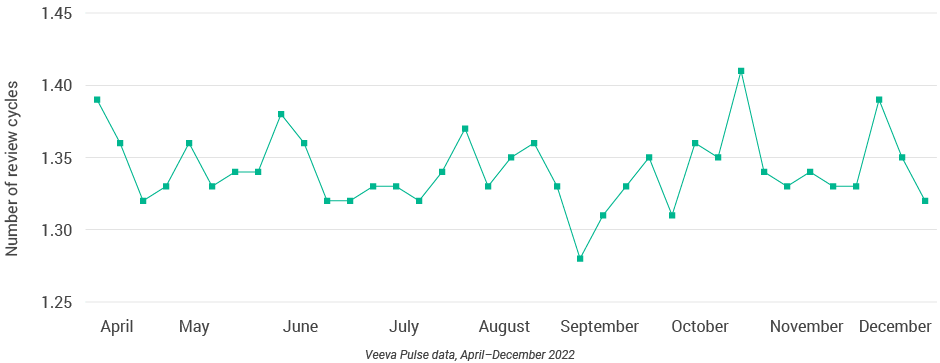
Figure 55: Number of review cycles, Latin America
Appendix: Data dictionary
Metric definitions
- Channel mix evolution over time: Weekly Veeva CRM activity volume broken down by the channel of engagement (in-person, phone, video, email, chat, or text)
- Q4 channel mix: Total Veeva CRM activity volume for October, November, and December 2022, broken down by engagement channel percentage
- Weekly activities per user: The average weekly number of Veeva CRM activities submitted per number of users active in Veeva CRM
- Approved email volume: Volume of approved emails sent via Veeva CRM
- Email open rate: Percentage of approved emails opened at least once out of all approved emails sent via Veeva CRM
- Email click rate: Percentage of approved emails clicked at least once out of all approved emails sent via Veeva CRM
- In-person % CLM usage: Percentage of in-person engagements that leveraged content in Veeva CRM
- Video % CLM usage: Percentage of video engagements that leveraged content in Veeva CRM
- Engage meeting % CLM usage: Percentage of Engage meetings that leveraged content in Veeva CRM
- Engage meeting duration: The average duration of Engage meetings in minutes
- Days to approval: The average total number of days it takes a document from initial upload/placeholder creation to be fully Approved for Distribution (Total Time to Market)
- Days in review: The average total number of days it takes a document from the first time it is sent for MLR review until it becomes Approved for Distribution
- Number of review cycles: The average number of MLR review cycles per document (number of iterations)
Engagement channel definitions
- In-person: Submitted calls with a CRM Standard Metrics call channel value of ‘in-person’
- Phone: Submitted calls with a CRM Standard Metrics call channel value of ‘phone’
- Video: Veeva Engage calls and video calls via other platforms that are then recorded as calls in Veeva CRM with a Standard Metrics call channel value of ‘video’
- Email: Approved emails and emails sent via other platforms that are then recorded as calls in Veeva CRM with a Standard Metrics call channel value of ‘email’
- Chat or text: Submitted calls with a CRM Standard Metrics call channel value of ‘chat or text’
User type definitions
- Sales: Users that have been classified with the ‘sales’ value in the CRM Standard Metrics user type field
- Key account manager: Users that have been classified with the ‘key account manager’ value in the CRM Standard Metrics user type field
- Medical: Users that have been classified with the ‘medical’ value in the CRM Standard Metrics user type field
- Top pharma: Top 17 global pharma companies by revenue
- Rest of industry: All other pharma companies
Region definitions
- Global: All markets globally
- Europe: Albania, Andorra, Armenia, Aruba, Austria, Azerbaijan, Belarus, Belgium, Bermuda, Bosnia and Herzegovina, Bulgaria, Croatia, Cyprus, Czech Republic, Denmark, Estonia, Finland, France, French Polynesia, Georgia, Germany, Greece, Greenland, Guadeloupe, Guernsey, Hungary, Ireland, Italy, Jersey, Latvia, Lithuania, Luxembourg, Macedonia, Malta, Martinique, Republic of Moldova, Monaco, Montenegro, Netherlands, New Caledonia, Norway, Poland, Portugal, Romania, Serbia, Slovakia, Slovenia, Spain, Sweden, Switzerland, Ukraine, United Kingdom
- Asia: Australia, Bangladesh, Bhutan, Brunei Darussalam, Cambodia, Cocos (Keeling) Islands, Indonesia, Japan, Kazakhstan, Republic of Korea, Kyrgyzstan, Malaysia, Mongolia, Myanmar, Nauru, Nepal, New Zealand, Philippines, Samoa, Singapore, Solomon Islands, Sri Lanka, Taiwan, Tajikistan, Thailand, Turkmenistan, Uzbekistan, Vietnam
- Latin America: Antigua and Barbuda, Argentina, Bahamas, Barbados, Belize, Bolivia, Brazil, Chile, Colombia, Costa Rica, Cuba, Dominican Republic, Ecuador, El Salvador, Guatemala, Guyana, Haiti, Honduras, Jamaica, Mexico, Nicaragua, Panama, Paraguay, Peru, Trinidad and Tobago, Uruguay, Venezuela
Methodology
The Veeva HCP 360 Trends Report is a quarterly industry benchmark for global and regional healthcare professional (HCP) engagement across the life sciences industry. The report is based on proprietary Veeva Pulse data and insights from field engagement activities of more than 80% of all industry representatives worldwide (Asia Pacific, Europe, Latin America, and the United States). Veeva CRM Standard Metrics — now used industrywide — provides the basis for consistent collection and measurement of engagement KPIs including channel mix and productivity across regions, roles, and market segments. The findings are based on approximately 600 million annual global field activities captured in Veeva CRM and Veeva CRM Engage, as well as Veeva Pulse Content Metrics, the first and only industry benchmark for commercial content performance based on real-world anonymized data collected across 350+ global pharma companies. The findings are also based on 42+ billion prescription (Rx) and medical (Mx) records captured in Veeva Compass, a U.S.-based longitudinal patient claims data set.
The Veeva Pulse Field Trends Report delivers insights that inform the industry and help field teams align their strategy to key market trends for improved commercial success. The global Veeva Business Consulting team also helps customers inform their strategies using industry benchmarking with Veeva Pulse data.